LEARN LINEAR REGRESSION CURVE IN 3 MINUTES – BLOCKCHAIN 101

In the cryptocurrency trading market, technical analysis is an indispensable tool to help investors identify market trends and make wise trading decisions. Among many technical analysis indicators, **Linear Regression Curve** is favored by many traders because it can directly display the market price trend. This article will take you in-depth understanding of the principle and usage of Linear Regression Curve index, and how to use this index to optimize investment strategy in cryptocurrency trading.

What is Linear Regression Curve?
Linear Regression Curve is a curve calculated based on the linear regression analysis method in statistics. Linear regression analysis reveals the relationship between variables by calculating the best fitting straight line of a group of data points. In financial markets, Linear Regression Curve is used to analyze price data and draw a straight line or curve showing price trends.
Simply put, Linear Regression Curve is a technical analysis tool to predict the future price trend by calculating the trend line of price data over a period of time. It can help traders identify the general trend of the market and make more informed buying and selling decisions.
Calculation and construction of Linear Regression Curve
The calculation process of Linear Regression Curve involves the following steps:
Choose a time period: First, determine the time period you want to analyze. For example, you can select the price data of the past 10 or 20 days.
Calculate Regression Line: Calculate the regression line of price data within the selected time period. The straight line is the “best fitting line” of the price point, that is, the price data point is the smallest from the sum of the straight lines.
Drawing curve: Draw a Linear Regression Curve according to the slope and intercept of the regression line. With the addition of new price data, the curve will be constantly updated to reflect the latest market trends.
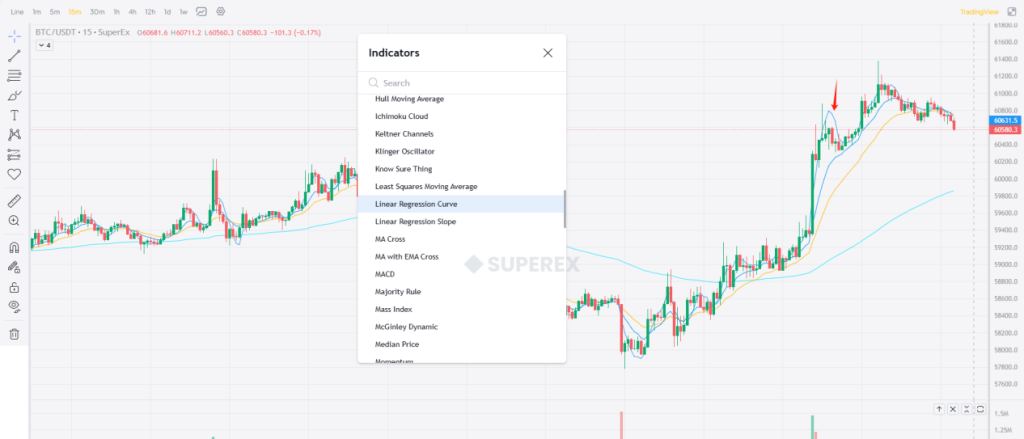
In SuperEx, this process is usually done automatically. Traders only need to choose a suitable time period, and SuperEx will generate a Linear Regression Curve and superimpose it on the price chart.
Application scenario of Linear Regression Curve
Linear Regression Curve has many application scenarios in cryptocurrency transactions:
1. Trend identification
Linear Regression Curve is a trend tracking indicator, which can help traders identify the main trends in the market. By observing the direction of the curve, traders can judge whether the current market is in an upward trend, a downward trend, or a sideways consolidation state.
- Upward trend: When the Linear Regression Curve inclines upward, it indicates that the market as a whole is in an upward trend, and buying should be considered at this time.
- Downward trend: when the curve inclines downward, it indicates that the market is in a downward trend, so we should consider selling or waiting.
- Side-by-side arrangement: when the curve is close to flat, it indicates that the market lacks a clear direction, and trading should be cautious at this time.
2. Support and resistance
Linear Regression Curve can also be used as a dynamic support and resistance level. In the upward trend, prices often get support when approaching the regression curve, while in the downward trend, prices may encounter resistance when approaching the regression curve.
- Support level: in the upward trend, traders can consider buying when the price is adjusted back to near the curve.
- Resistance level: in the downward trend, traders can consider selling when the price rebounds to near the curve.
3. Price Deviation and Regression
When the price deviates far from the Linear Regression Curve, it usually indicates that the market may have a callback or reversal. Traders can take advantage of this and take reverse actions when the price deviates from the curve extremely, waiting for the price to return to the vicinity of the curve.
- Excessive deviation: when the price is significantly higher or lower than the regression curve, it may mean that the market is overbought or oversold for a short time, and the price may return to the curve.
- Regression trading: traders can enter the market when the price deviates from the curve excessively, and make use of the trend of price returning to the curve to trade.
How to use Linear Regression Curve in cryptocurrency transactions?
In the cryptocurrency market, Linear Regression Curve can be used as an auxiliary indicator and combined with other technical analysis tools to improve the accuracy of trading decisions. Here are some practical strategies:
1. Combined with the moving average
Combining Linear Regression Curve with moving average (MA) can better confirm the trend. For example, when the regression curve and the short-term moving average are inclined upward at the same time, a strong upward trend can be confirmed. On the contrary, when both of them incline downward at the same time, it indicates that the market is in a downward trend.
2. Combining with RSI
Relative Strength Index (RSI) is another popular technical analysis index, which is often used to identify the overbought and oversold state of the market. Combining Linear Regression Curve with RSI can help traders identify potential market reversal points. When the price deviates far from the regression curve and RSI shows overbought or oversold, the possibility of reversal is greater.
Step 3 set a stop loss
In order to control the risk, traders can set a stop position when trading with Linear Regression Curve. For example, in the upward trend, the stop loss can be set below the regression curve; In a downtrend, the stop loss can be set above the regression curve.
Tag
Linear Regression Curve is a powerful technical analysis tool, which can not only help traders identify market trends, but also serve as dynamic support and resistance to guide trading decisions. However, just like any technical index, Linear Regression Curve is not a panacea. Investors should combine it with other analytical tools and maintain reasonable risk management.
In the face of the complexity and volatility of cryptocurrency market, mastering and reasonably using Linear Regression Curve can help you take the lead in trading and make full preparations for market changes in September and the future.

IN-3-MINUTES@2x-1-1024x576.png)


Responses