LEARN PIVOT POINTS STANDARD IN 3 MINUTES – BLOCKCHAIN 101

The Introduction
In the stock, futures, and crypto markets, understanding the key points of market movements is crucial. Pivot Points Standard, a widely popular technical analysis tool, has become an indispensable assistant for many traders to predict market direction and formulate trading strategies. Unlike the trend judgment methods in previous articles, Pivot Points Standard is more inclined to predict the possible support and resistance levels of the next trading day for users.
This article will delve into the principles and applications of Pivot Points Standard, revealing the mysterious veil of this trading market tool and helping you excel in your trading.

The Basic Definition of Pivot Points Standard
The origin of Pivot Points Standard cannot be traced back to a specific time, and it is believed to be a popular technical indicator that has been accumulated and optimized by the market over time. As we can see from SuperEx, the Pivot Points Standard is presented in the following figure:
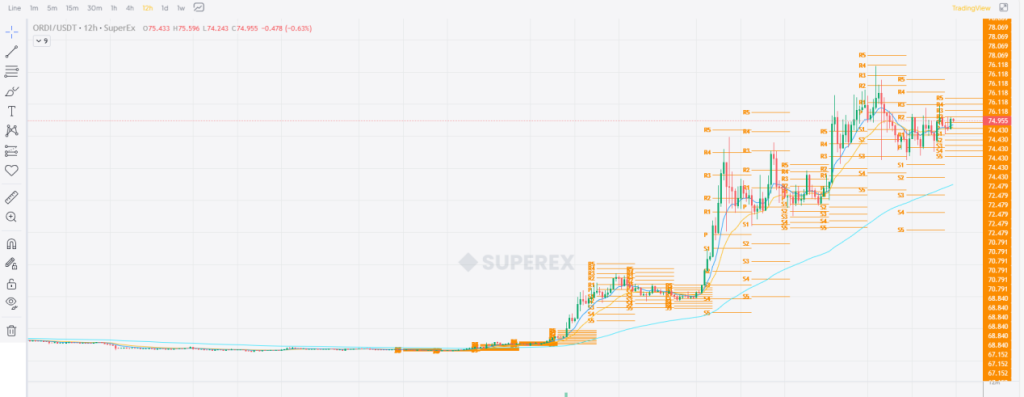
A Pivot Point refers to the arithmetic average of the high, low, and close prices of the previous period. The Pivot Points Standard is based on this and derives support and resistance levels through certain calculation methods. These levels provide traders with references for potential market movements, helping them determine when to enter or exit the market and how to set stop losses and take profits.
Calculation Methods of Pivot Points Standard
Calculating a series of key price levels based on the high, low, and close prices of the previous period to assist analysts in predicting possible support and resistance levels for the next trading day.
The most classic calculation methods include the standard Pivot Point (PP), Support 1 (S1), Support 2 (S2), Resistance 1 (R1), and Resistance 2 (R2).
The formulas for these levels vary depending on market analysis needs, but one of the most common methods is as follows:
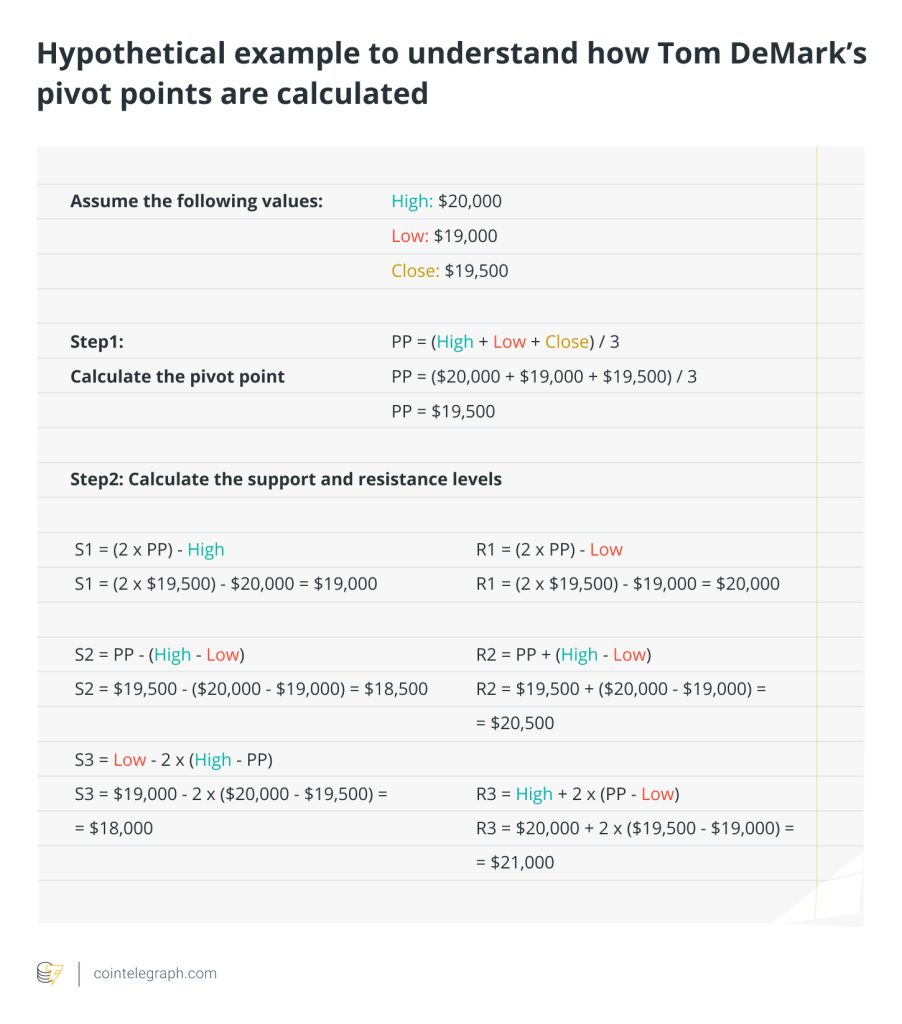
- Standard Pivot Point(PP) = (High + Low + Close) / 3
- Support1(S1) = (2 * PP) – High
- Support2(S2) = PP – (High – Low)
- Resistance1(R1) = (2 * PP) – Low
- Resistance 2(R2) = PP + (High – Low)
This series of calculations provides traders with key level points for the next trading day, which are expected to be places of market reversals or continuation of trends.
Applications of Pivot Points Standard
In practical trading, the applications of Pivot Points Standard are versatile. Firstly, it provides traders with reliable support and resistance levels, helping them determine when they may consider entering or exiting the market. This is crucial for formulating reasonable stop-loss and profit-taking strategies. Secondly, Pivot Points Standard is also widely used in intraday trading because these levels often exhibit high accuracy in short timeframes, providing important clues for traders who enter and exit the market quickly.
Specific judgment methods are as follows:
Price relative to Pivot Point position:
- If the current price is above the Pivot Point, a possible uptrend may occur.
- If the current price is below the Pivot Point, a possible downtrend may occur.
Traders often focus on the position of prices relative to the Pivot Point, support levels, and resistance levels.
Strength of support and resistance levels:
- The strength of support and resistance levels depends on their position relative to the Pivot Point.
- If support and resistance levels are close to the Pivot Point, they may be stronger.
- Strong support and resistance levels can be crucial for forming trading signals.
Crossovers and Cross Validation:
- When Pivot Points from different time periods cross each other, stronger support or resistance may form.
- Cross Validationrefers to validating Pivot Points signals through other technical indicators or chart patterns.
The relationship between price and support/resistance levels:
- If prices rebound near support levels, it may be a buy signal.
- If prices fall near resistance levels, it may be a sell signal.
Example:
We can apply the Pivot Points Standard from SuperEx’s technical indicators library. We can find that SuperEx has default set five sets of support and pressure levels for users. Based on the above judgment method, we can conclude that:
- The prices rebound near support levels, it may be a buy signal.
- The more support levels the price crosses, the weaker the rebound is. The less support levels the price crosses, the stronger the rebound is. The more pressure levels the price crosses, the stronger the pressure is. The less pressure levels the price crosses, the weaker the pressure is.
- If the current price is higher than Pivot Point, there may be an uptrend.
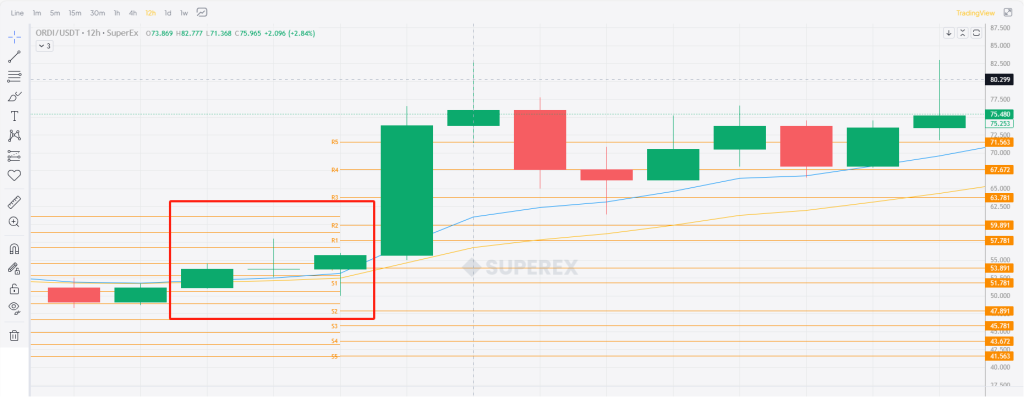
Based on the judgment methods mentioned above, we can easily determine that the price area within the red box is a good buying point: the price is higher than the Pivot Point and near S1, and it is higher than the support level but lower than the resistance level.
Conclusion:
Overall, as a market analysis tool, Pivot Points Standard provides traders with the ability to grasp opportunities in volatile markets better. However, traders should treat it rationally, combine with other analysis methods to form comprehensive and reliable trading decisions. In this volatile financial market, continuous learning and improving one’s analytical abilities are the keys to long-term success.


Responses