LEARN KNOW SURE THING(KST)IN 3 MINUTES – BLOCKCHAIN 101
In the financial markets, investors are constantly seeking technological tools that can provide insights into market trends and offer a comprehensive perspective. The “Know Sure Thing” (KST) indicator has brought a new way of interpreting the market for investors.
This article will delve into the origins, calculation methods, application areas, and the value of the KST indicator in market analysis.
Origins and Basic Principles of KST
The history of the “Know Sure Thing” (KST) indicator can be traced back to 1992, introduced by technical analyst Martin Pring, a revered figure in the field of market analysis and trading. His contributions have earned him widespread recognition.
The KST indicator first appeared in Pring’s book “Technical Analysis Explained,” published in 1991, which became a classic in the field of technical analysis. As a new technical tool introduced in the book, the KST indicator attracted the attention of investors and technical analysts.
The uniqueness of this indicator lies in its comprehensiveness and the weighted consideration of price rate changes over different time periods. The introduction of KST aimed to provide a more comprehensive analysis of market trends, combining short-term, medium-term, and long-term perspectives to better understand the overall market dynamics.
Over time, the KST indicator has been adopted by market participants and has found its place in the toolbox of technical analysis tools. Investors use KST to capture long-term, medium-term, and short-term market trends to support their trading decisions.

Calculation Method of KST Indicator
The calculation of the KST indicator involves the following main steps:
- Calculate the rate of change for four different time periods:This includes short-term (ROC12), medium-term (ROC26), long-term (ROC39), and very long-term (ROC52) rate of change.
- Apply weights to each period’s rate of change:Different weights are applied to the short-term, medium-term, long-term, and very long-term rate of change to highlight the impact of different periods.
- Sum the four weighted rates of change:This gives the raw value of KST.
- Apply a secondary smoothing:Use a 9-day smoothing.
- Calculate the signal line of KST:This is done by calculating the 9-day moving average of KST.
Practical Application of KST Indicator
Applying the KST indicator should be in conjunction with the investor’s personal trading style and the actual situation of the market environment. Here are some basic application methods, but note that no technical indicator is 100% accurate and should be used in conjunction with other analysis tools.
- Trend Judgment and Reversal Points:
- Bullish Trend: When the KST line crosses above its signal line, it may indicate the start of a bullish trend, signaling a buy.
- Bearish Trend: When the KST line crosses below its signal line, it may indicate the start of a bearish trend, signaling a sell.
- Divergence: Observe divergence between KST and price. When KST forms a peak while the price forms a trough, it may suggest a trend reversal.
- Generation of Buy and Sell Signals:
- KST Line Crossover: A buy signal is generated when the KST line crosses above the signal line; a sell signal is generated when it crosses below.
- Zero Line Crossover: A buy signal may be generated when the KST line crosses above the zero line; a sell signal may be generated when it crosses below.
- Multi-Period Analysis:
- Combining Different Periods: Use the KST indicator to synthesize the rate of change of different periods, helping investors to understand market trends more comprehensively and reduce blind spots of a single period.
- Combining Long and Short Periods: Try different combinations of periods, such as shorter period KST with longer period KST, to find more sensitive trading signals.
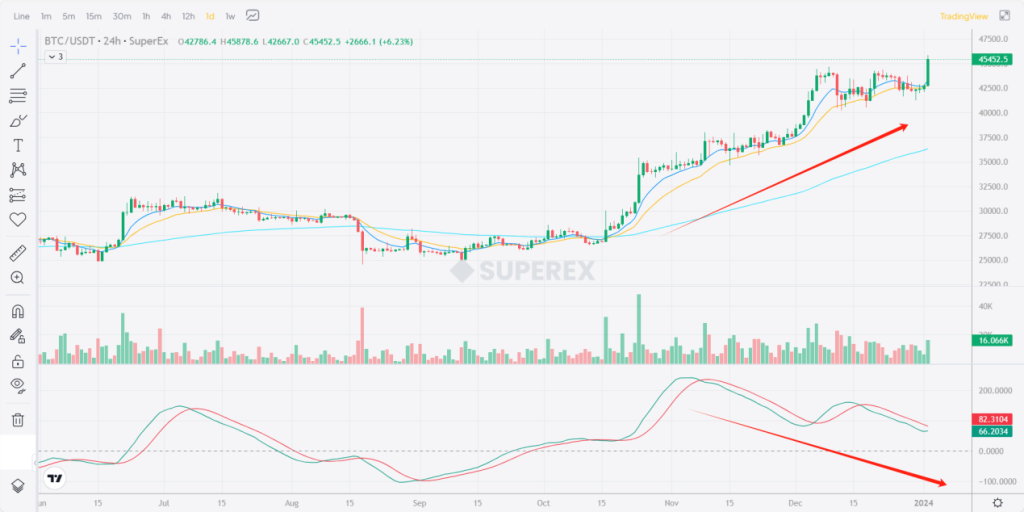
Example:
As shown in the graph, the BTC price trend and KST first show a clear divergence (as shown by the red arrows), which also suggests that the BTC price trend might reverse. Whether the signal is accurate will be evident over time.
The introduction of the KST indicator has enriched the family of technical analysis tools, providing more options for investors. However, investment decisions should not rely solely on a single indicator but should be based on a comprehensive consideration of the overall market situation, other technical indicators, and fundamental factors. When using the KST indicator, investors need to operate cautiously, apply it flexibly, and continuously optimize its use in market practice to better serve their investment decisions. The KST indicator, like a key in the market, opens a broader door to market understanding for investors.


Responses