LEARN COPPOCK CURVE IN 3 MINUTES – BLOCKCHAIN 101

Introduction
In the vast ocean of financial markets, finding suitable investment opportunities is akin to treasure hunting at sea, full of challenges. In this adventurous journey, there is a secret weapon known as the “Coppock Curve,” which harbors the unique power to reveal market trends. Today, we will unveil the mysteries of the Coppock Curve and learn how to utilize this powerful tool to guide our investment decisions.
This course will start with the concept of the Coppock Curve, delving into its calculation methods and practical application, to better grasp market dynamics in subsequent investment decisions.
The Coppock Curve (CC) has its historical roots tracing back to the 1960s. Its founder, Edwin Coppock, was an American financial advisor. Coppock proposed this concept in the early 1960s, aiming to develop a tool for long-term investors to capture buying opportunities at market bottoms.
The Coppock Curve was initially designed to help investors find the timing for long-term investments, especially at market bottoms. Coppock believed that market bottoms are often accompanied by a long-term accumulation process, and investors could capture profits by identifying signals during this process.
Originally developed for the stock market, the indicator has since been applied to other financial markets, such as cryptocurrencies and indices. The Coppock Curve gradually gained fame, attracting the attention of investors and technical analysts.
Overall, as a momentum oscillator, the Coppock Curve provides long-term investors with a tool to identify changes in market trends. Its historical roots reflect the continuous development and innovation of technical analysis in the markets.
Understanding the Coppock Curve is not an inscrutable task, but to use it correctly, one must first comprehend its underlying principles. The core of this indicator lies in how it reveals market trend changes through the Rate of Change (ROC) and Weighted Moving Average (WMA). Building on this foundation, we will unveil the mysteries of the Coppock Curve.

Interpreting the Coppock Curve Signals
- Bottom Signal: The Coppock Curve often generates its strongest signals at market bottoms, where investors might find long-term buying opportunities. A shift from a negative to a positive value in the Coppock Curve is considered a buy signal.
- Top Signal: The Coppock Curve can also be used to identify market tops. When the Coppock Curve shifts from a positive to a negative value, it may indicate an impending long-term trend reversal, which is viewed as a sell signal.
- Suitable for Long-Term Investment: Since the Coppock Curve is designed to capture changes in long-term trends, it is more suitable for long-term investors. Short-term fluctuations might impact the signals it generates, so caution is advised when using it for short-term trading.
Understanding the Calculation of the Coppock Curve
The calculation of the Coppock Curve involves two main steps: first, calculating the Rate of Change (ROC) for the last 14 months’ prices, and then applying a 10-month Weighted Moving Average (WMA) to the short-term ROC. This yields the Coppock Curve value, which can be observed to determine market bottoms or tops.
Let’s decipher the calculation method with a formula:
Calculation of the Coppock Curve involves two main steps:
Short-Term ROC Calculation: Calculate the Rate of Change (ROC) for the last 14 months’ prices.
ROC = (Today’s Close – Close 14 months ago) / Close 14 months ago × 100
Smoothing the Long-Term ROC: Calculate a 10-month Weighted Moving Average of the short-term ROC.
Coppock Curve = WMA(ROC, 10)
A positive value of the Coppock Curve suggests a potential long-term upward trend, while a negative value indicates a potential downward trend.
Formula Interpretation:
WMA stands for Weighted Moving Average. It is a method of calculating an average where different data points are assigned different weights, emphasizing the contribution of certain data points to the average.
For the Coppock Curve calculation, WMA is used to smooth the short-term ROC (Rate of Change). Specifically, the WMA is calculated as follows:
WMA = (W1X1 + W2X2 + … + Wn*Xn) / (W1 + W2 + … + Wn)
Where:
X1, X2, … Xn are the data points to be averaged;
W1, W2, … Wn are the weights for the respective data points.
In the context of the Coppock Curve, each data point of the short-term ROC is assigned a weight, typically distributed according to some mathematical function to ensure recent changes have more influence. Thus, through WMA, the short-term ROC is smoothed out, forming the Coppock Curve value.
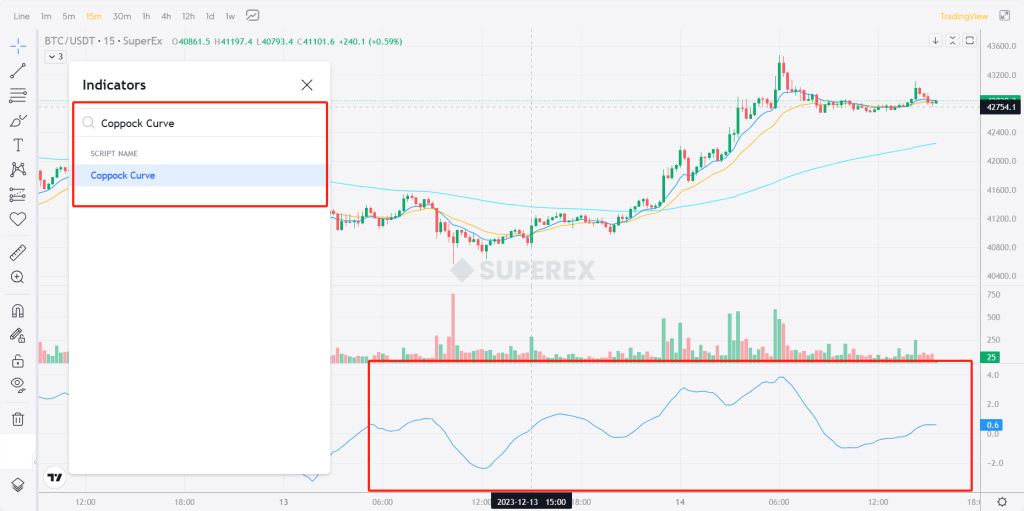
Of course, some students new to technical indicators might find the calculation complex. No worries, SuperEx has plotted the Coppock Curve chart for users and configured the correct parameters. Simply search for the Coppock Curve in the indicator library, as shown in the following image:
Conclusion
Unveiling the Unique Code of Market Trends By learning the Coppock Curve, we seem to possess a unique code to unveil market trends. This is not just a tool for technical analysis but also a valuable aid for investors. Whether in the tumultuous waves of the market or on its calm surface, the Coppock Curve provides an effective antidote, serving as an irreplaceable guide for investors.


Responses