LEARN ACCUMULATION/DISTRIBUTION IN 3 MINUTES – BLOCKCHAIN 101
Introduction
The Accumulation/Distribution (A/D) is a technical analysis indicator used to measure the inflow and outflow of money in the trading market. It aims to reveal the strength of price trends and potential trends in price movements.
This indicator is based on the assumption that when buying pressure is high, money is more likely to be accumulated, and when selling pressure is high, money is more likely to be distributed. Therefore, the A/D indicator attempts to determine the relative strength of buyers and sellers in the market by observing the relationship between volume and price.
Accumulation/Distribution (A/D) Overview
The history of the Accumulation/Distribution (A/D) indicator dates back to the early 1970s, introduced by technical analysis expert Marc Chaikin. Not only a distinguished technical analyst, Chaikin also worked as an analyst and fund manager on Wall Street. He made significant contributions to market volatility and technical analysis during his career, with the A/D indicator being one of them.
During that period, the application of technical analysis gradually became mainstream, and traders started to focus on the relationship between price and volume. Chaikin realized that traditional price charts did not provide enough information to determine the direction of market funds. Therefore, he innovatively introduced the A/D indicator, integrating volume into price analysis for a more comprehensive assessment of market health.
The calculation method of the Accumulation/Distribution indicator is based on Chaikin’s observation: when the price rises, if the closing price is close to the day’s high, it may indicate positive fund accumulation; and when the price falls, if the closing price is close to the day’s low, it may indicate an outflow of funds. This concept provides the basis for the calculation of the A/D indicator.
With the further development of technical analysis methods, the A/D indicator has gradually become an important tool for investors and traders in analyzing stock and cryptocurrency markets. Its unique ability to combine price trends and volume makes the A/D indicator distinct in interpreting market fluctuations. Today, the A/D indicator remains one of the widely used indicators in technical analysis, providing traders with deep insights into market money flow.
Accumulation/Distribution (A/D) Indicator Formula
The calculation of the A/D indicator is based on daily price fluctuations and volume. Here are the calculation steps:
Calculate daily price movement:
Money Flow Multiplier = {Close – Low – (High – Close)} / (High – Low)
Calculate daily Money Flow Volume:
Money Flow Volume = Money Flow Multiplier × Volume
Accumulation/Distribution value calculation:
Accumulation/Distribution Line = Previous A/D Line + Money Flow Volume
Applications of the A/D Indicator:
The A/D indicator provides key information about market money flow direction, with the following applications for traders:
- Trend Confirmation: An upward trend in the A/D Line may indicate market funds are accumulating, supporting the current upward price trend.
- Trend Divergence: When the A/D Line diverges from the price trend, it may indicate weakening market momentum, potentially leading to a trend reversal.
- Volume Validation: The A/D indicator can be used to validate the volume behind price movements, ensuring that price changes are sufficiently supported by funds.
- Consistency between Price and Money Flow: The trend of the A/D Line can be used to check the consistency between price movements and money flow, thereby enhancing the reliability of trading decisions.
Example
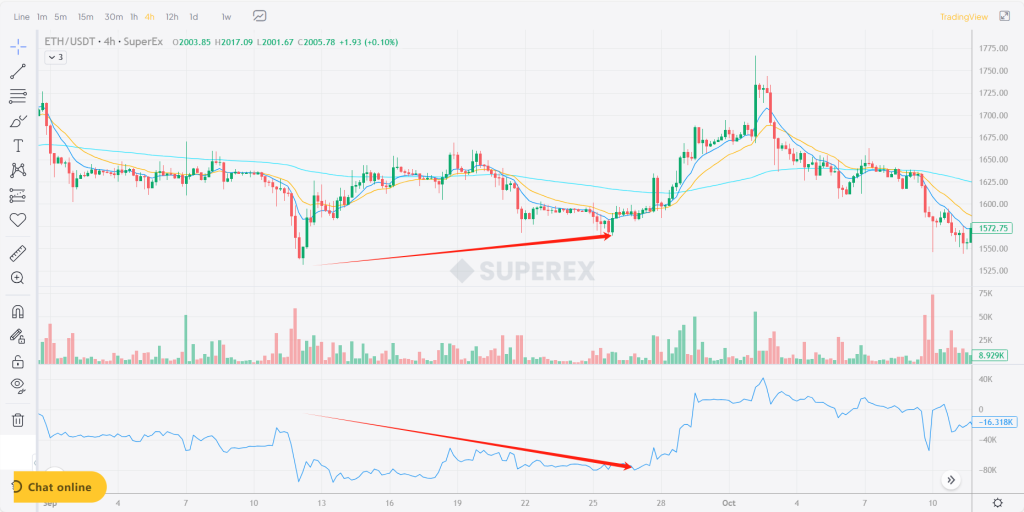
In the following chart, the arrow area shows a typical trend divergence pattern where the ETH price trend and the A/D curve move in opposite directions, indicating weakening downward market momentum and a potential trend reversal.
At the same time, we can see that after the end of the arrow area, the A/D reverses and rises, accompanied by a significant increase in volume, indicating that the trend change is sufficiently supported by funds, followed by a steady rise in the ETH price.
Summary:
The Accumulation/Distribution indicator, by integrating price and volume information, offers traders a more comprehensive view of the market. It plays a crucial role in confirming trends, identifying divergences, and validating trading volumes, making it one of the commonly used tools in technical analysis. Traders should use this indicator in conjunction with other technical analysis tools to gain a more comprehensive understanding of the market.


Responses