LEARN ACCUMULATIVE SWING INDEX IN 3 MINUTES – BLOCKCHAIN 101
INTRODUCTION
In the previous lessons, we have learned that trend and volume are the two most basic and core fundamental analysis points of the trading market, and today we are going to learn that Accumulative Swing Index is one of the indicator parameters about trend. We must realize that the trading trend can not be judged in one or two trading days, unless you do ultra-short-term trading. Normal trading trends are accumulated over a long period of time, and once a trend is formed, it will not be reversed.
It becomes critical to understand the accumulation and potential reversal points of a market’s megatrend. This is where technical analysis tools such as the Accumulative Swing Index (ASI) become valuable.

Introduction to the ASI
The Accumulative Swing Index, or ASI, is a powerful technical analysis indicator designed to help traders assess the strength of long-term trends and potential price reversal points in the cryptocurrency market.The core idea of the ASI is to calculate cumulative price swings to reveal the strength and direction of market trends. It provides investors with a more comprehensive approach to understanding price trends in the digital currency market.
Although the ASI dates back to technical analysis expert J. Welles Wilder Jr.’s development in the 1970s, it still plays an important role in today’s crypto trading market. This powerful indicator has been proven and applied for years and is widely used in the financial markets, especially for long-term trend analysis and identification of price reversal points.
In the next article, we will delve into how the ASI works, how it is calculated, and how to apply it in cryptocurrency trading for more accurate market insights. Whether you are new to cryptocurrencies or an experienced trader, understanding ASI will help improve your trading decisions and better cope with market volatility. Let’s unravel the mystery of ASI together and explore its potential in the crypto trading market.
Calculation of ASI
The Accumulative Swing Index (ASI) is a complex calculation that involves multiple steps and requires the use of a number of intermediate variables and conditions to calculate. Below is a brief overview of how the ASI is calculated:
- Initial value of ASI: The calculation of ASI starts with an initial value. Usually, the initial value of ASI is set to zero or an initial equilibrium point.
- Calculation of R-value (Swing Index): First, the Swing Index (SI) needs to be calculated for each calculation cycle.
The calculation of SI involves the following steps:
- High (High): the highest price of the current cycle.
- Low: the lowest price of the current cycle.
- Previous Close: The closing price of the previous cycle.
1)Calculate R (Raw Swing Value): R is equal to the current cycle’s high minus the previous cycle’s close, minus the current cycle’s low minus the previous cycle’s close, and take the absolute value.
R = |High – Previous Close| – |Low – Previous Close|
2)Calculate Swing Index (SI): SI is a smoothed version of the R-value, usually adding the previous cycle’s SI to the current R-value.
SI = Previous SI + R
3)calculate the Scaling Factor: ASI calculation also involves a Scaling Factor (Scaling Factor), which helps to keep the ASI value within a reasonable range. Scaling Factor is usually a very small value, such as 0.015.
4)calculate the ASI: ASI is calculated using the following formula:
ASI = Previous ASI + SI – (Scaling Factor * Previous SI)
An example
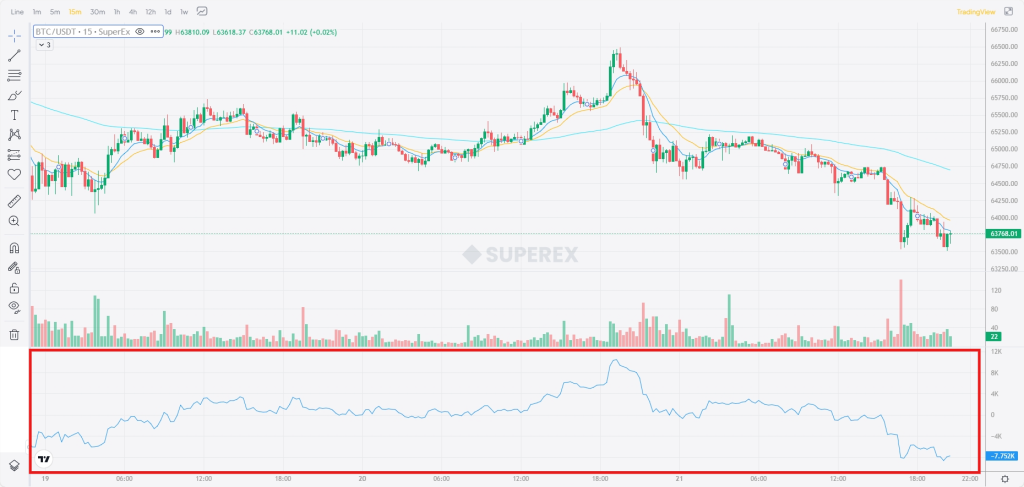
Without the need for an example, all SuperEx users can find the Accumulative Swing Index in SuperEx’s Indicator Library, and SuperEx has already plotted the ASI curve for you, as shown below:
ASI Interpretation
To interpret the Accumulative Swing Index (ASI) results correctly, you need to consider the following points:
- Direction of the ASI: First of all, the direction of the ASI is very important. Positive values usually indicate the strength of an uptrend, while negative values usually indicate the strength of a downtrend. An ASI value close to zero may indicate that the market is moving sideways. Based on the direction of the ASI, you can make an initial assessment of the market’s movement.
- Volatility of ASI: It is also important to observe the volatility of the ASI value. Larger fluctuations mean that changes in market trends may be more dramatic, while smaller fluctuations indicate that the market is relatively stable. Changes in volatility can provide clues about market sentiment.
- Support and Resistance Levels: ASI values are usually correlated with price action. When the ASI crosses the zero line and remains positive in an uptrend, this may indicate support levels. Conversely, when the ASI remains negative in a downtrend, this may indicate a level of resistance. These levels can be used as reference points for buying or selling.
- Consistency of ASI with price: Changes in the ASI should be consistent with the price action. If the ASI indicates an increase in the strength of the uptrend, and the price also rose, this may be a strong buy signal. Vice versa, ASI indicates an increase in the strength of the downtrend, and the price fell, may be a sell signal.
- Reversal Signals: The ASI can also be used to identify potential price reversal points. When the ASI reaches an extreme value (positive or negative) and reverses, this may indicate a possible reversal of the market trend. These reversal signals can provide clues for trading decisions.
It is important to note that the ASI often needs to be used in conjunction with other technical analysis tools to gain more comprehensive market insights. Also, ASI values may vary from market to market and from time period to time period, so they need to be interpreted on a case-by-case basis. In actual trading, experience and comprehensive analysis are key to successfully utilizing the ASI.


Responses