LEARN MOVING AVERAGE TRIPLE IN 3 MINUTES – BLOCKCHAIN 101
Introduction
In the previous course, we learned the golden fork/dead fork, which is an important indicator to determine the future trend. Both the golden fork and the tongzi golden fork can indicate a high probability of rising in the future period. And all the golden forks and dead forks are determined by MA.
The Moving Average Triple we are going to learn today adds a K-line on the basis of the previous golden fork course, in order to identify trends and trading signals more accurately.

Introduction to Moving Average Triple
“Moving Average Triple” is a technical analysis index used to analyze the trend of asset prices. It combines the moving averages of three different periods, usually including short-term, medium-term and long-term moving averages, to help identify changes in trends and determine buying or selling signals.
Its history can be traced back to the early days of technical analysis. Moving average itself is one of the oldest technical analysis tools, which is used to smooth price data to help identify trends. With the passage of time, analysts and traders began to try to understand the market dynamics more comprehensively by combining the moving averages of different periods.
Although the exact origin and development history are not clear, “Moving Average Triple” can be regarded as an improvement and variation of the moving average method. By using moving averages of different periods, this method aims to provide more trend information and trading signals.
The popularity of this method may be related to the improvement of computing technology and the development of computerized transactions. It is easier to calculate multiple moving averages, so this method is widely used in modern financial markets.
Among them, the short/medium/long lines of the Moving Average Triple are:
- Short-term moving average: Generally, short-term moving average adopts a short time period, such as the average price of 5 days and 10 days. This line quickly reflects the change of price, so it fluctuates greatly on the chart.
- Mid-term moving average: the mid-term moving average adopts a medium time period, such as the average price of 20 days or 50 days. It is smoother, reflects the medium-term trend and helps to filter out short-term fluctuations.
- Long-term moving average: the long-term moving average takes a long time period, such as the average price of 100 days. It is smoother, reflects the long-term trend and helps to identify the main price trend direction.
How to use Moving Average Triple
- Golden Cross: When the short-term moving average crosses the medium-term moving average from below and produces an upward cross signal, it is regarded as a potential buying signal, suggesting that the price may start to rise.
- Death Cross: When the short-term moving average crosses the medium-term moving average from above and produces a downward cross signal, it is regarded as a potential selling signal, suggesting that the price may start to decline.
- Trend confirmation: the direction of the long-term moving average can be used to confirm the overall trend of the price. If the price is above the long-term moving average, this may indicate an upward trend; Conversely, if the price is below it, it may indicate a downward trend.
For example:
We still take BTC in SuperEx spot market as an example. Please see the picture below:
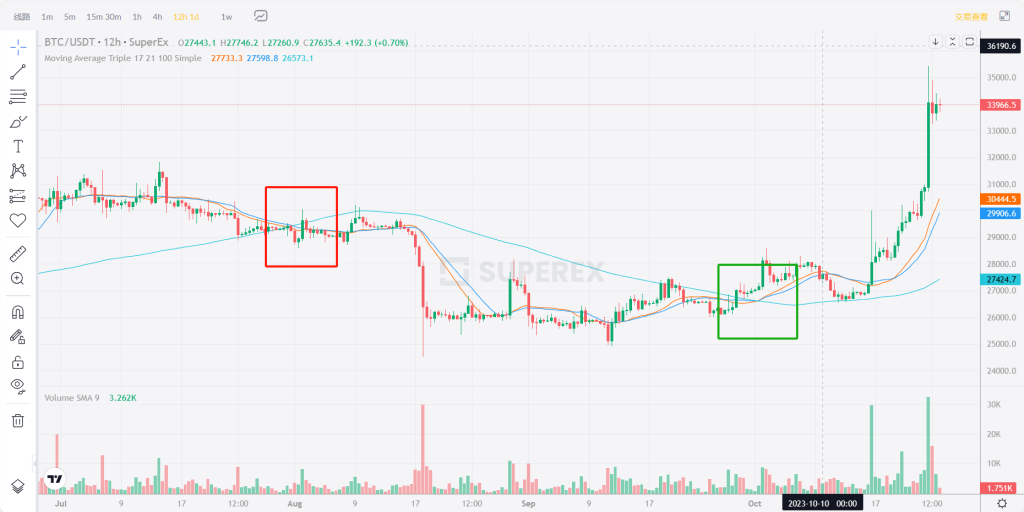
We can clearly see two intersections in the figure, which are the intersections in the red box. The yellow and dark blue lines representing short-term MA cross the sky blue lines representing long-term MA, forming a dead intersection, and the price of BTC will continue to fall in the future.
In the green box, the yellow and dark blue lines representing the period MA cross the sky blue lines representing the long-term MA, forming a golden cross. In the future, the price of BTC will continue to rise.
The effectiveness and application of “Moving Average Triple” index will be affected by market conditions and time period. It is very useful in long-term trend analysis, especially in investment and portfolio management, but it can also be used for decision-making in short-term transactions. The application of this indicator has been deeply recognized in the field of technical analysis and has become one of the important tools to analyze market trends and price trends.


Responses