LEARN NET VOLUME IN 3 MINUTES – BLOCKCHAIN 101

In LESSON 125, we learned that in a trading market, there are two basic indices that affect the overall direction of the market. One is volume, and the other is trend. The two are complementary. If a currency wants to rise, it cannot do without a large influx of funds to push up prices. Therefore, volume determines how much it rises or falls. The trend, on the other hand, affects the overall trend of prices over a period of time, which can be simply understood as how long they rise or fall.
In LESSON 125,we explained trend related indicators. In this class, we will discuss the relevant knowledge points about quantitative energy: NET VOLUME;

Introduction to Net Volume
In the financial field, “Net Volume” is a common indicator commonly used to represent the net buying or selling situation in the trading volume of a specific market or exchange on a specific trading day. This indicator helps to analyze the buying and selling pressure and emotions in the market.
Simply put, the trading volume we see in the trading market includes the total trading volume of buying and selling, and the Net Volume indicator can help us to filter selectively net buying or selling situations, allowing us to better judge the market trend.
The history of Net volume
“Net Volume” as an indicator originates from the trading and analytical practices of financial markets. The origin of this concept can be traced back to the early days of the stock market and other financial markets. Its development and use are mainly related to the following aspects:
Transaction records and data: With the development of financial markets, there have been more electronic transactions and records, making transaction data more accurate and easy to analyze. Exchanges and financial institutions began to collect and record the quantity and price of each transaction. This provides a data basis for calculating net trading volume.
Technical analysis: Technical analysis is a method of predicting future price trends by analyzing market prices and trading volumes. Transaction volume data is a key element of technical analysis. Traders and analysts are beginning to use net trading volume to determine buying and selling sentiment and manipulation behavior in the market.
Market trend analysis: Market participants realize that understanding the buying and selling pressures and emotions in the market is crucial for predicting market trends and fluctuations. Net trading volume has become a powerful tool that can help market participants better understand the inner dynamics of the market.
Financial instruments and software: With the continuous development of computer technology, the use of financial market analysis tools and software has become more widespread. This makes it easier for analysts and traders to calculate and visualize net trading volume data.
Therefore, the origin of the “Net Volume” indicator can be traced back to the evolution of financial markets and the advancement of analytical technology. It is a commonly used tool in the financial field to evaluate market sentiment, trends, and liquidity, and as part of technical analysis.
The role of Net Volume
- Net trading volume: Net trading volume refers to the difference between the buying volume and the selling volume on a trading day. If the net trading volume is positive, it means that the buying volume is greater than the selling volume on that trading day, indicating a strong booming sentiment or buying pressure. If the net trading volume is negative, it indicates significant selling pressure.
- Market sentiment: Net trading volume is usually used to evaluate market sentiment and trends. If market participants are generally booming, the net trading volume may be positive. On the contrary, if market participants are generally bearish, the net trading volume may be negative. This can help analyze the short-term trend of the market.
- Manipulation detection: Net trading volume can also be used to detect market manipulation behavior. A large number of net selling transactions may indicate that manipulators are trying to push down stock prices. On the contrary, a large number of net buying transactions may indicate that manipulators are pushing up stock prices.
- Liquidity: Net trading volume can also be used to evaluate market liquidity. If the net trading volume is high, it may indicate that the market is very active and the trading volume is high. Low net trading volume may indicate a less active market.
The formula of Net Volume
Net Trading Volume=Buying Trading Volume – Selling Trading Volume
Choose a time period and repeat the above calculation formula until you obtain a series of net trading volume data, each corresponding to a trading day. For the convenience of observation, it can be plotted as a table.
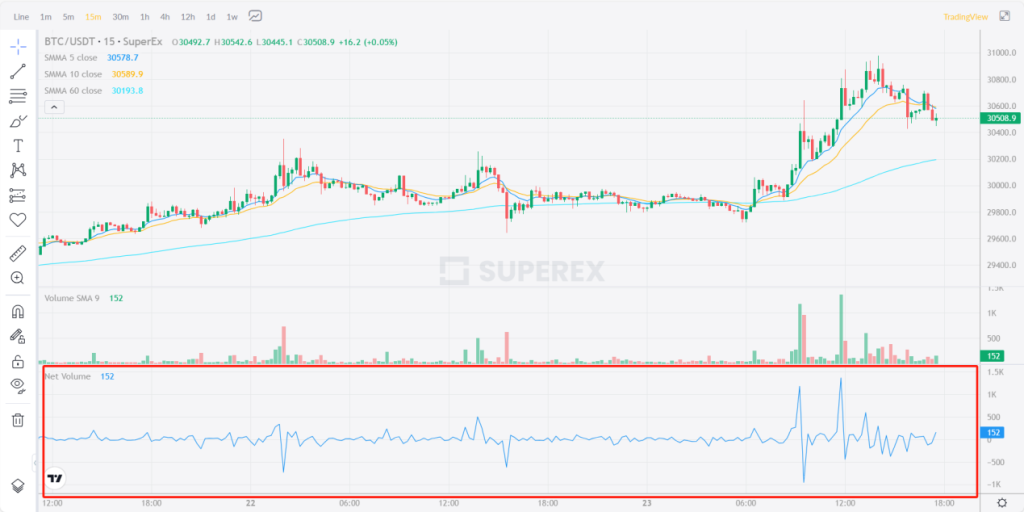
In SuperEx, you can directly access the settings of Net Volume. SuperEx has already drawn a table for you to observe by default, as shown in the following figure:
How to judge market sentiment through Net Volume
- Directionality: First, check the sign of the net trading volume. If the net trading volume is positive, it indicates that the buying volume is greater than the selling volume, which usually indicates strong bullish sentiment and the market may be bullish. If the net trading volume is negative, it indicates that the selling volume is greater than the buying volume, which usually indicates strong bearish sentiment and the market may be bearish.
- Trend analysis: Analyze net trading volume and price trends together. If the price rises and is accompanied by positive net trading volume, it may indicate a strong market. If the price drops and is accompanied by negative net trading volume, it may indicate a weak market.
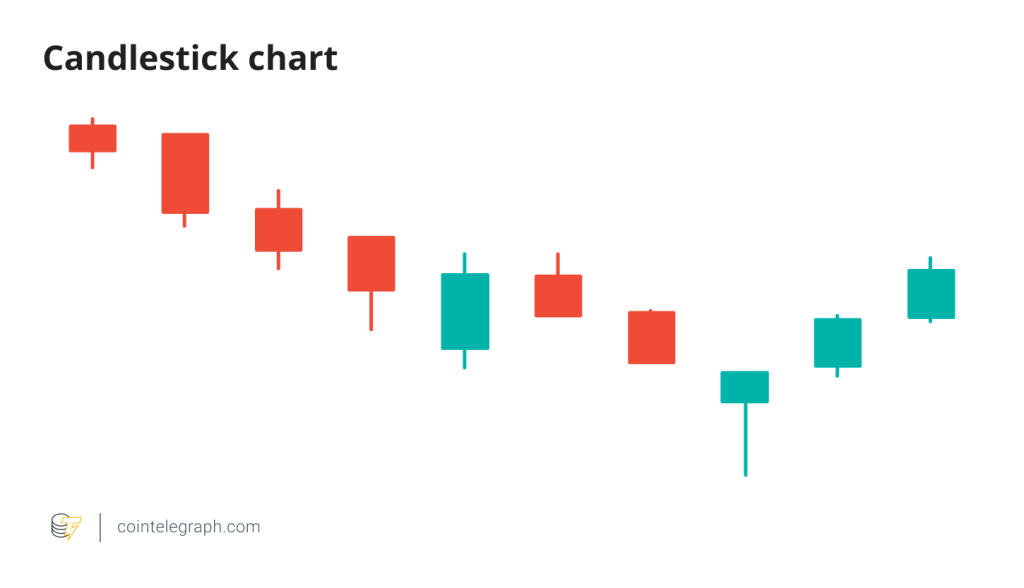
- Trading volume bar chart: Draw a trading volume bar chart, where positive net trading volume is represented by one color and negative net trading volume is represented by another color. This visualization method can help you see a clearer comparison between buying and selling pressures.
- Horizontal comparison: Compare the net trading volume on different trading days. If you see a gradual increase in positive and net trading volume during a series of trading days, it may indicate that market buying pressure is increasing. On the contrary, if the negative net trading volume gradually increases, it may indicate that the market selling pressure is increasing.
- Combining with other indicators: Typically, net trading volume is used in conjunction with other technical indicators such as moving averages, relative intensity indices (RSI), MACD, etc. to obtain more comprehensive market analysis. Cross analysis between different indicators can provide more information about market dynamics.
It should be pointed out that net trading volume is a relatively simple indicator, but to accurately interpret market conditions, other factors need to be comprehensively considered. In practice, technical analysts and traders often use multiple indicators and analytical methods to make decisions. In addition, market sentiment and trends may change over time, so promptly updating of analysis is crucial.

Responses