LEARN TREND STRENGTH INDEX IN 3 MINUTES – BLOCKCHAIN 101
Introduction
In the trading market, there are two fundamental indices that influence the overall market direction: volume and trend. They complement each other. For a cryptocurrency to rise, there must be a significant inflow of capital to push up the price, which means volume determines how much it rises or falls. On the other hand, the trend influences the overall price movement over a period, which can be understood as how long it rises or falls.

Synopsis
In most technical indicators, determining volume and discerning the trend are primary objectives. However, trends vary in strength. A weak trend can easily reverse, leading to potential investment losses. For instance, if we observe that BTC is in an upward trend and decide to enter the market, a weak upward trend might reverse, causing a drop in price and, consequently, a loss on our investment.
Therefore, assessing trend strength is a crucial step. The TREND STRENGTH INDEX (TSI) we will explore today is a technical indicator designed to gauge the strength of an asset’s trend. TSI generally covers price and its rate of change to calculate trend strength, assisting traders in discerning the current market trend’s strength and making wiser trading decisions.
TSI Overview
TSI is a technical indicator introduced by M. H. Pee in 1993 in his research paper titled “A New Trend Strength Index”. The aim of this indicator is to address some limitations of traditional trend indicators like RSI (Relative Strength Index) and Stochastic Oscillator. The primary intention behind TSI’s design was to offer a more accurate and sensitive method of measuring trend strength.
TSI is mainly used for:
- Measuring Trend Strength:TSI gauges the strength of an asset’s price trend by comparing the differences between the fast and slow-moving averages. A positive TSI value indicates a potential upward market trend, while a negative value suggests a possible downward trend.
- Providing Buy and Sell Signals:The values and trend shifts in TSI can serve as a basis for trading signals. Generally, when TSI starts to rise, it might signal a buying opportunity, indicating that the market’s upward trend is strengthening. Conversely, when TSI starts to decline, it might be a selling signal, suggesting the market’s downward trend is intensifying.
- Assisting in Risk Management:TSI can help traders understand market risks better. A higher TSI value might signify a strong trend, whereas a lower value might indicate a weak trend. This assists traders in formulating risk management strategies, such as setting stop-loss points.
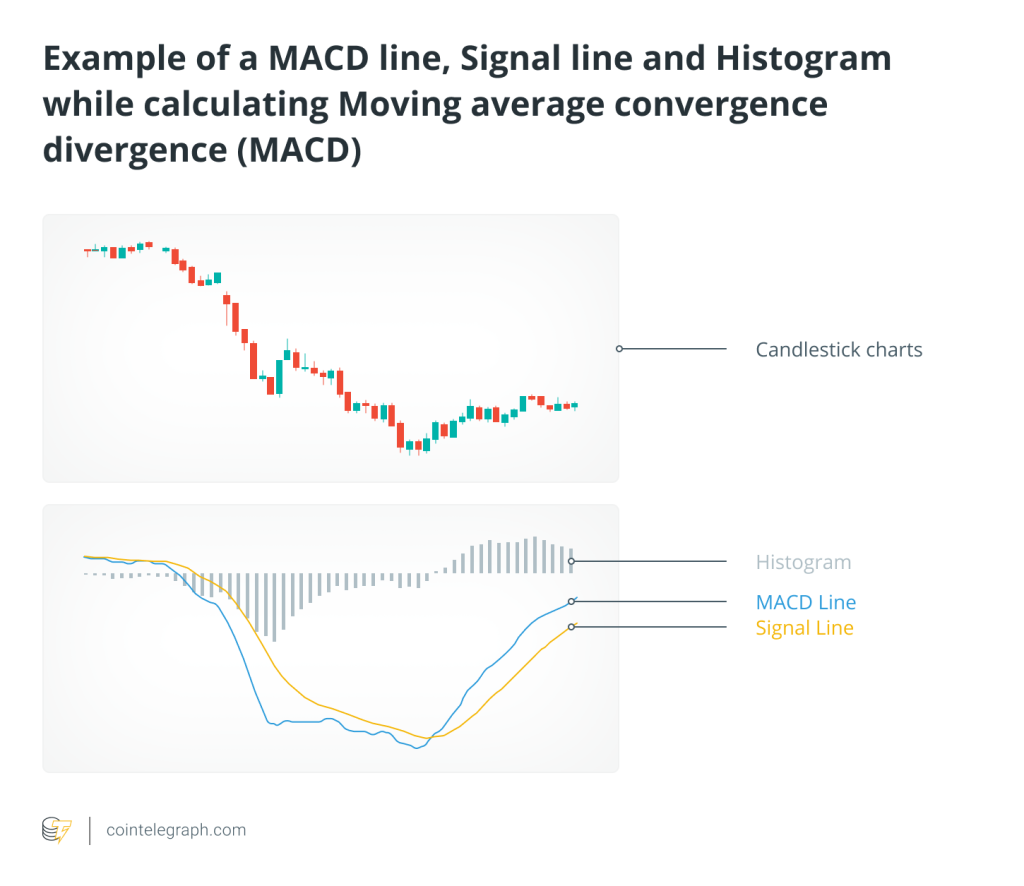
- Combining with Other Indicators:TSI is often paired with other technical indicators and analytical methods for a more comprehensive market analysis. Traders typically use TSI alongside moving averages, MACD (Moving Average Convergence Divergence), and other indicators to enhance their trading strategies.
TSI Calculation Method:
TSI typically employs two moving averages to determine trend strength.
These two moving averages are the fast moving average of price changes (usually set to 13 days) and the slow-moving average (typically set to 25 days).
The calculation steps are as follows:
– Compute Price Change: First, calculate the asset’s price change, which is the current price minus the price from the previous period.
– Calculate the Fast Moving Average: Apply a fast-moving average (usually 13 days) to the price change.
– Calculate the Slow Moving Average: Apply a slow-moving average (usually 25 days) to the price change.
– Compute TSI: The TSI is derived from the value of the fast moving average minus the slow-moving average, usually expressed as a percentage. TSI values can be either positive or negative.
Interpreting Trend Strength:
TSI values can be used to interpret the strength and direction of the market trend.
Here are some potential scenarios:
– When TSI is positive, it suggests the market might be in an upward trend. The higher the TSI value, the stronger the trend.
– When TSI is negative, it indicates the market might be in a downward trend. The lower the TSI value, the stronger the trend.
– When TSI is close to zero, it suggests the market trend might be relatively weak or the trend direction might be unclear.
Practical Calculation of TSI
The calculation process for the “Trend Strength Index” (TSI) is relatively complex, typically involving several steps and calculations of moving averages. Below are the general steps to calculate TSI, using BTC as an example, along with the respective formulas:
Step 1: Calculate Price Change
First, compute the price change for BTC, which is the difference between the current price and the price of the previous period (usually the previous day’s closing price).
Price Change = Current Price – Previous Period’s Price
Step 2: Calculate the Fast Moving Average
Typically, TSI uses a 13-day Exponential Moving Average (EMA) to compute the average value of the price change. The formula for calculating the fast-moving average is:
Fast MA = 13-day EMA of Price Change
Step 3: Calculate the Slow Moving Average
The slow-moving average usually employs a 25-day EMA for its calculation. The formula to determine the slow-moving average is:
Slow MA = 25-day EMA of Price Change
Step 4: Calculate TSI
Finally, TSI is calculated by subtracting the slow-moving average from the fast-moving average, then dividing the result by the absolute value of the slow-moving average. The formula to compute TSI is:
TSI = ((Fast MA – Slow MA) / |Slow MA|) * 100
In this formula, the TSI result is typically expressed as a percentage and can be either positive or negative.
It’s important to note that calculating TSI requires specific technical analysis tools or software, as it involves calculations of moving averages and EMAs. These are typically provided by professional analytical software.
However, within the trading market offered by SuperEx, tools for TSI analysis are already available. This allows users to directly obtain TSI values for reference. It’s suggested to combine TSI with other indicators for a more comprehensive view.
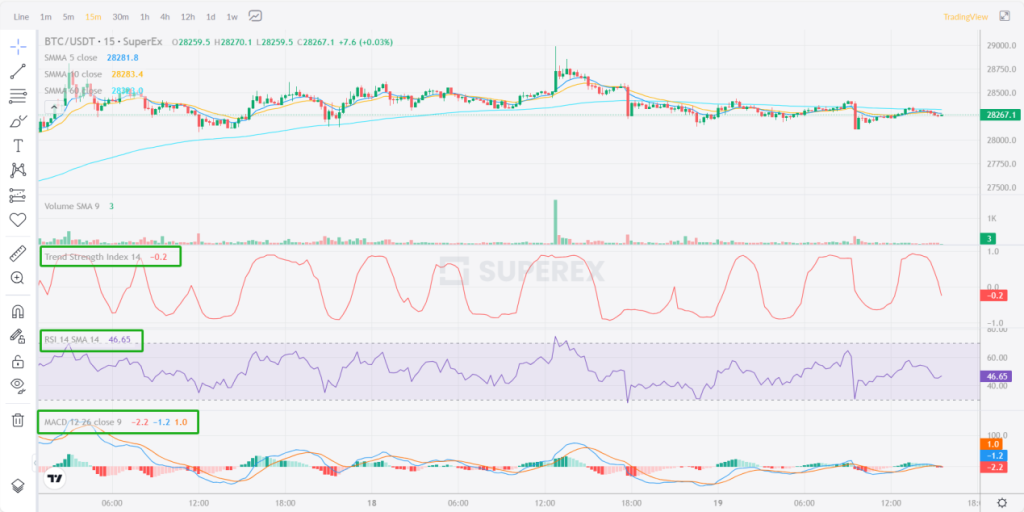
As depicted in the above illustration, I reference TSI, RSI, and MACD simultaneously on SuperEx, merging multiple indicators to gain a more precise assessment and make relatively accurate decisions.


Responses