BNB, AR, XMR, and TIA set to rally — Will Bitcoin's $70K breakout be the trigger?
Bitcoin price action could remain sideways for longer, but BNB, AR, XMR, and TIA may see some short-term gains.

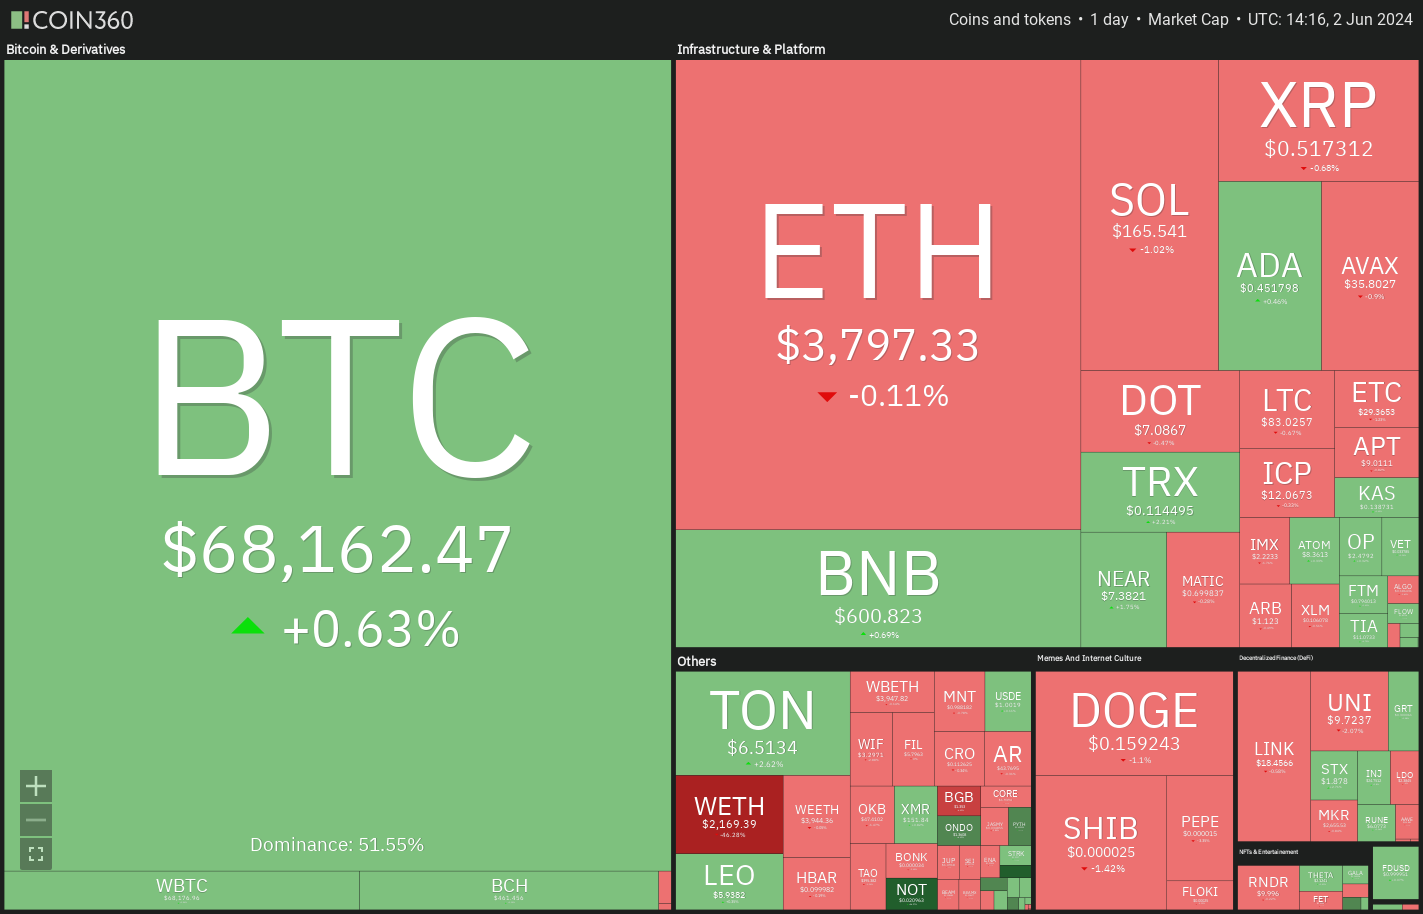
Bitcoin (BTC) is facing resistance above the psychological barrier at $70,000, but a positive sign is that the bulls have not ceded much ground to the bears. Bitcoin is down marginally by just under one percent this week.
Bitcoin’s range-bound action over the past few days has not hampered investments into the spot Bitcoin exchange-traded funds. Farside Investors data shows more than $2.1 billion in net inflows into the Bitcoin ETFs since May 14. This suggests that the investors are accumulating Bitcoin, anticipating a breakout to the upside.
Veteran trader Peter Brandt is bullish on Bitcoin in relation to gold in the long term. In a post on X, Brandt said that the ratio of gold to Bitcoin is likely to remain volatile for another 12-18 months, but after that, the rally could hit a new high where 100 ounces of gold is needed to buy one Bitcoin. Currently, each Bitcoin is worth about 29 ounces of gold.
Could Bitcoin bounce off the important support levels, pulling the cryptocurrency markets higher? Let’s study the charts of the top five cryptocurrencies that may lead the recovery.
Bitcoin price analysis
Bitcoin dipped below the support line of the symmetrical triangle pattern on May 31, but the bears could not sustain the lower levels. This suggests that the bulls continue to buy on dips.
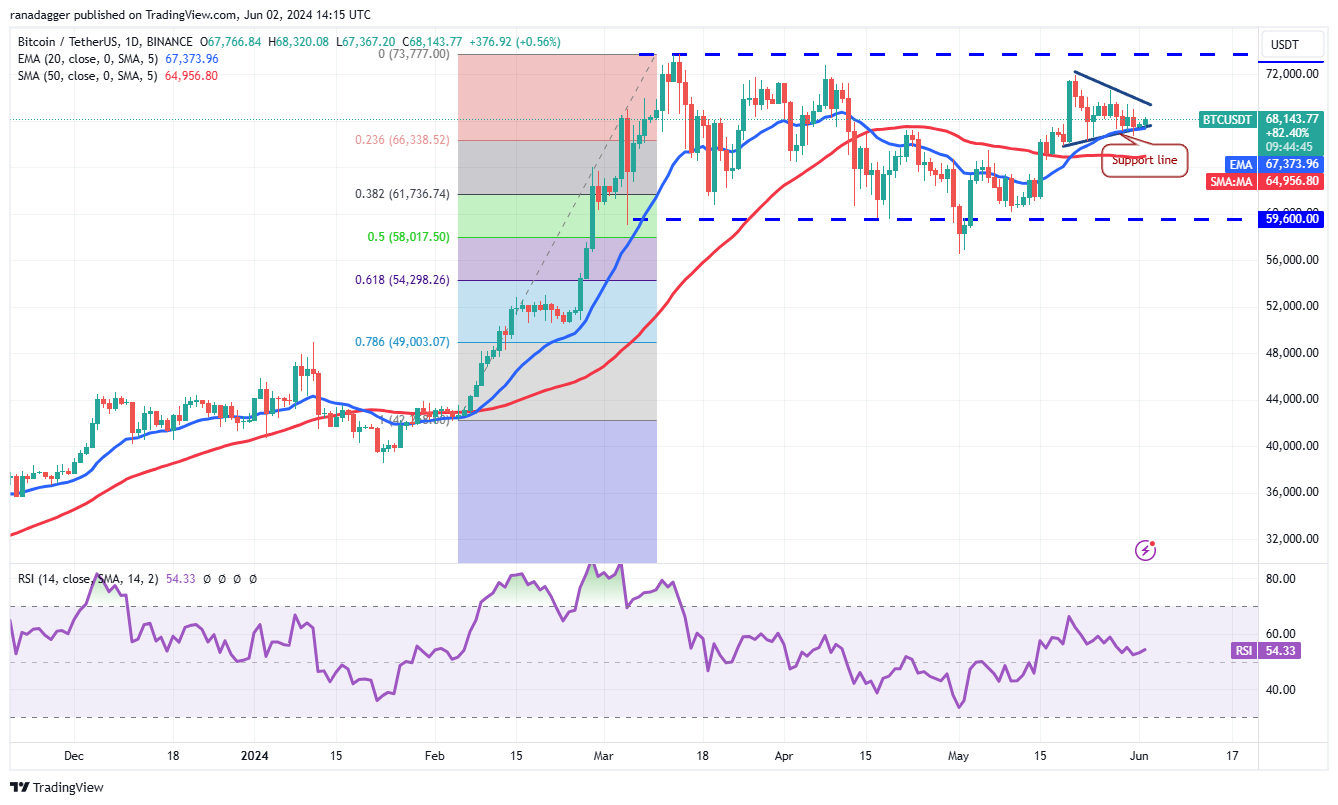
The bulls will have to push and maintain the price above the triangle to gain the upper hand. If they do that, the BTC/USDT pair could rise to the overhead resistance of $73,777. The bulls may find it difficult to overcome this barrier. But if they do, the pair could surge to $80,000.
Contrarily, if the bulls fail to achieve a strong rebound off the current level, it will increase the likelihood of a break below the triangle. The pair might then slump to the 50-day simple moving average ($64,956) and then to $61,000.
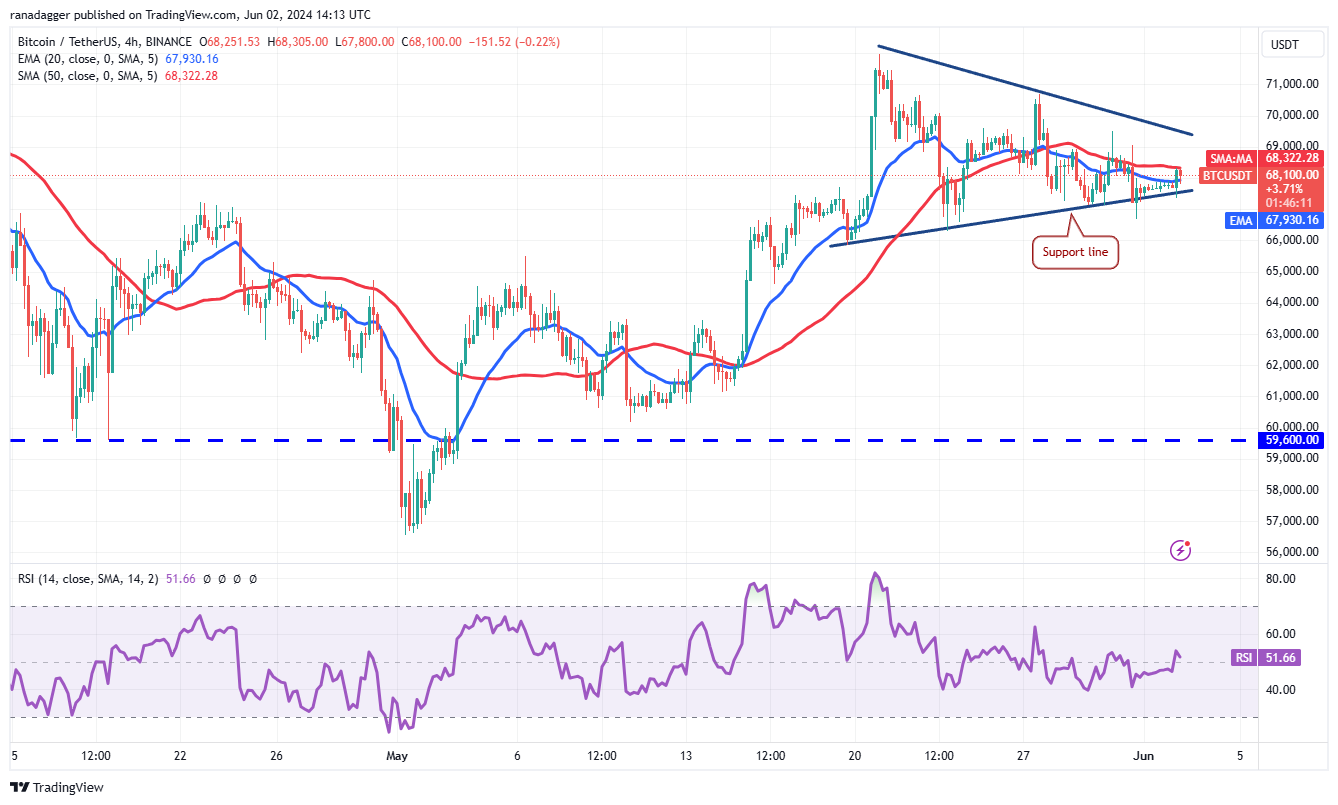
Bitcoin has been trading between the 50-SMA and the support line of the symmetrical triangle pattern. The bears will try to strengthen their position by pulling the price below the support line. If they do that, the pair may plunge toward the pattern target of $61,500.
Instead, if the price rises above the moving averages, it will suggest that the bears are losing their grip. The BTC/USD pair may climb to the triangle’s resistance line, where the bears are expected to mount a strong defense. However, if the bulls prevail, the pair can resume its journey to $73,777.
BNB price analysis
BNB (BNB) has been trading above the moving averages for the past few days, indicating that the bulls are aggressively defending the level.
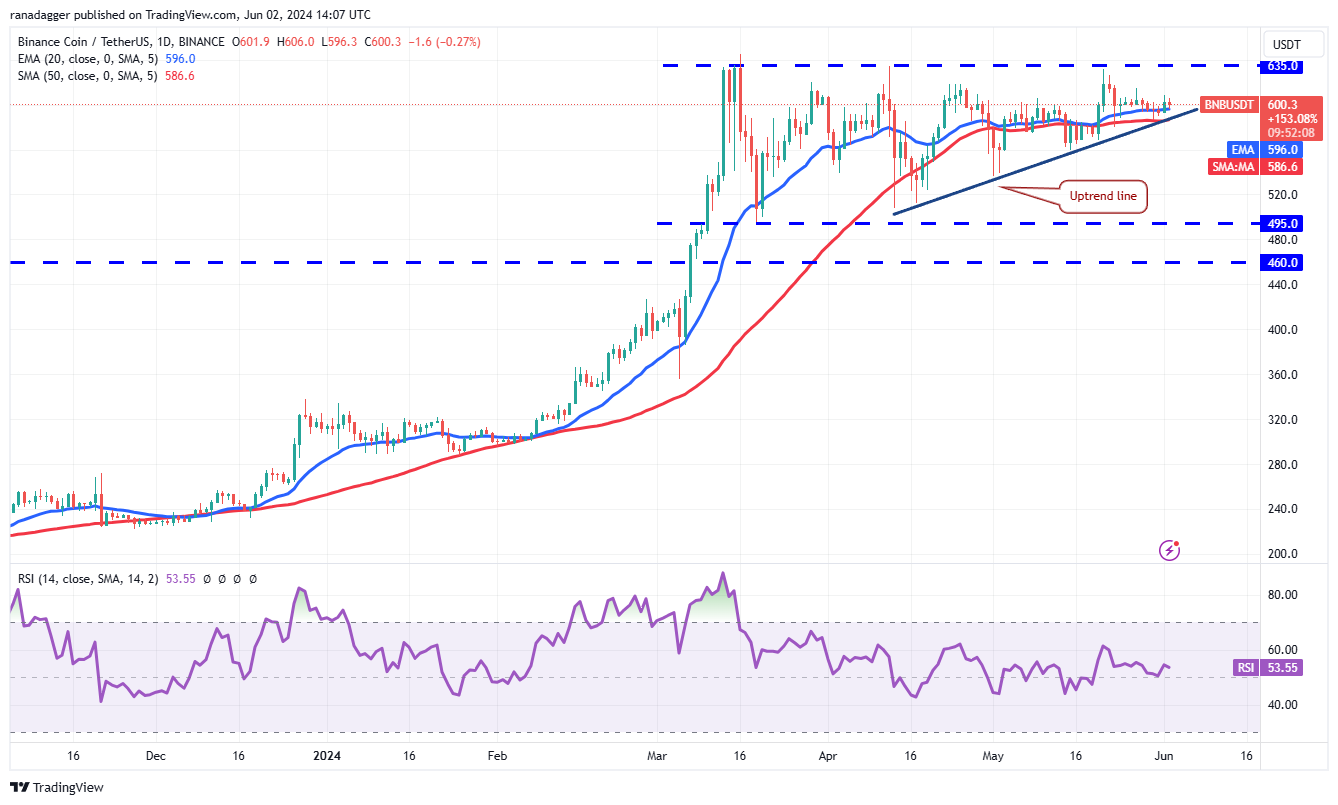
The bulls will try to drive the price to the overhead resistance of $635. This is a crucial resistance to watch out for because a break and close above it could start the next leg of the uptrend to the pattern target of $775.
Contrary to this assumption, if the price turns down and breaks below the uptrend line, it will negate the ascending triangle pattern. That could accelerate selling and sink the BNB/USDT pair to $536.
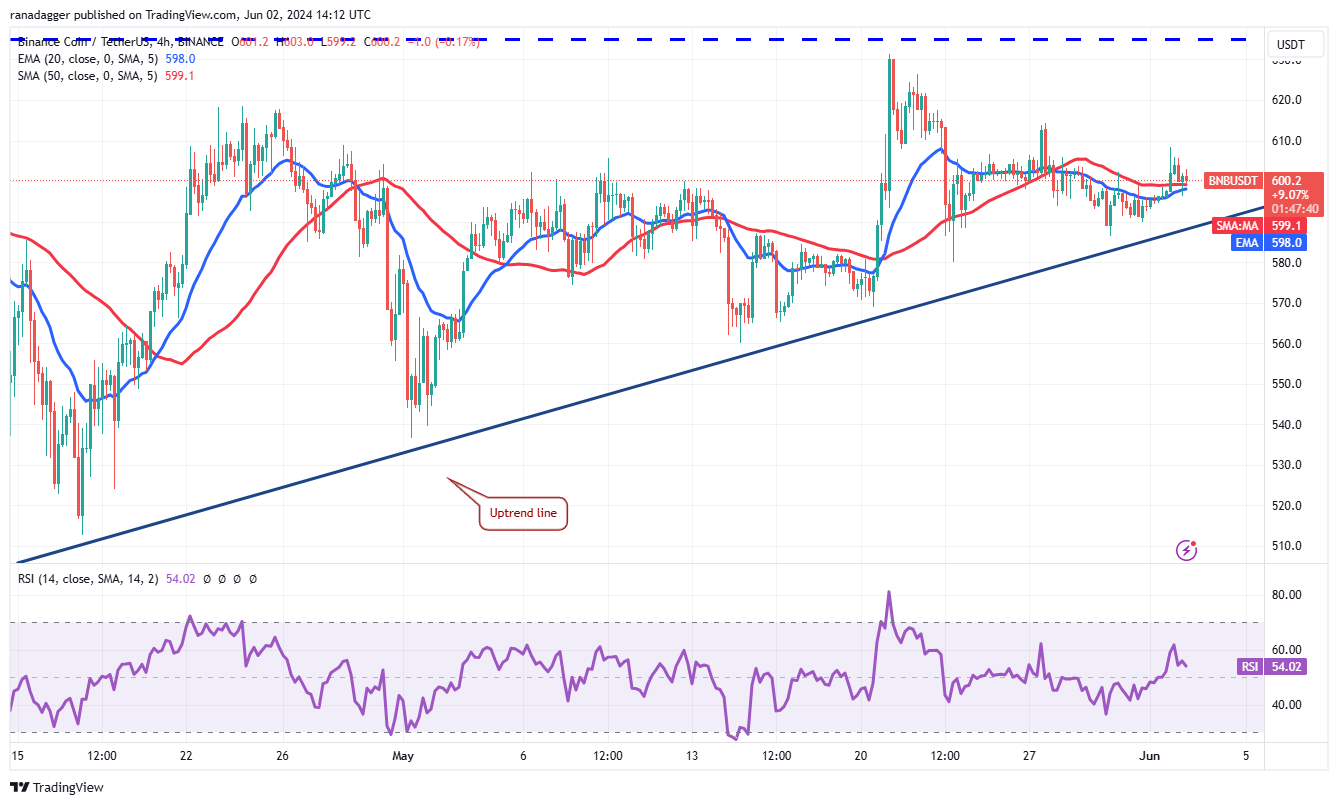
The pair has risen above the moving averages, indicating that the bulls are attempting a comeback. There is a minor resistance at $615, but if this level is crossed, BNB price could reach $635. The 20-exponential moving average is turning up gradually, and the relative strength index (RSI) is in the positive territory, giving the bulls a slight edge.
This optimistic view will be invalidated in the near term if the price turns down and tumbles below the uptrend line. That could start a deeper correction to $560 and later to $536.
Arweave price analysis
Arweave (AR) rebounded off the 50-day SMA ($37.58) with strength, indicating aggressive buying at lower levels.
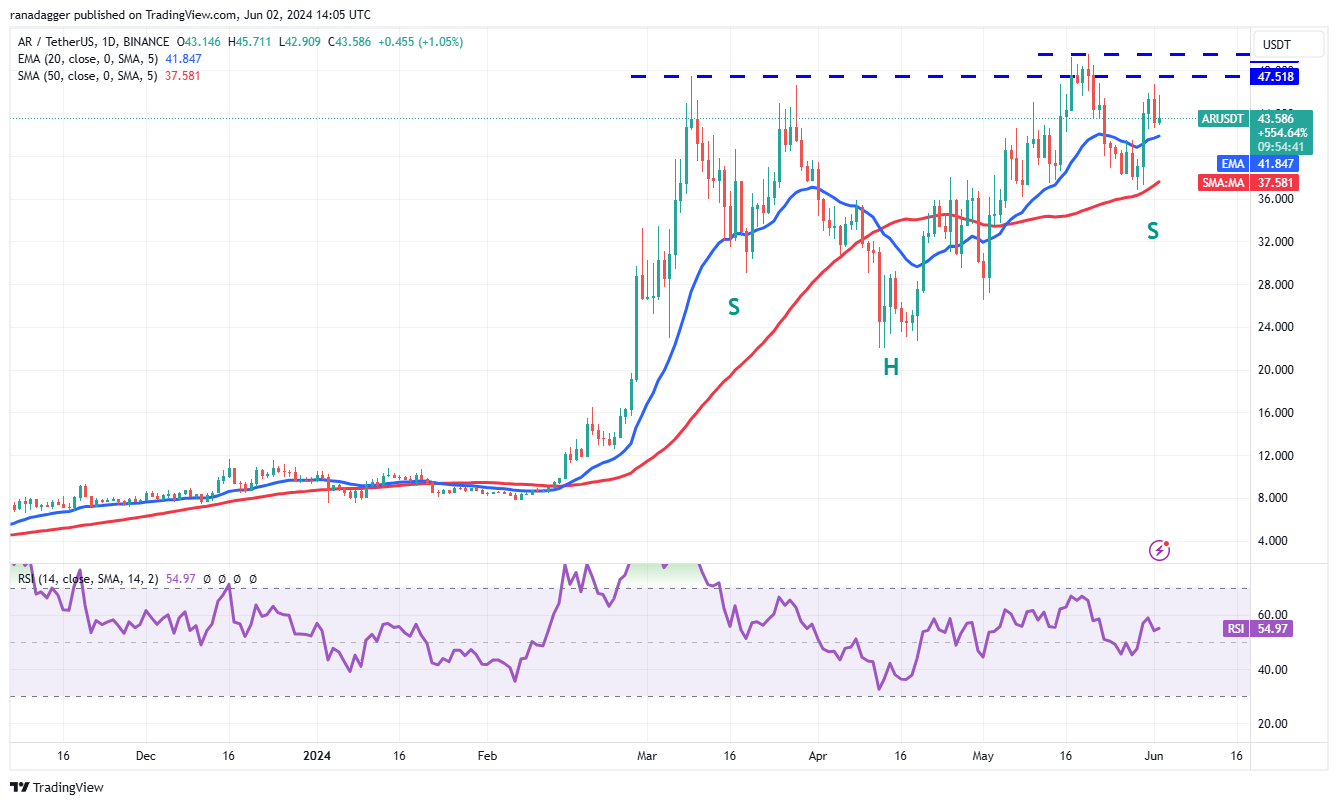
The bulls are likely to face stiff resistance in the zone between $47.51 and $50, but the rising 20-day EMA ($41.84) and the RSI in the positive area suggest that the path of least resistance is to the upside. A break above $50 will complete an inverse head-and-shoulders pattern, opening the doors for a new uptrend. The pattern target of this setup is $72.
Contrarily, if the price turns down from the overhead zone, it will signal that the bears are not relenting. The AR/USDT pair could slide to the moving averages, which are likely to act as a strong support. The bears will have to tug the price below $36 to seize control.
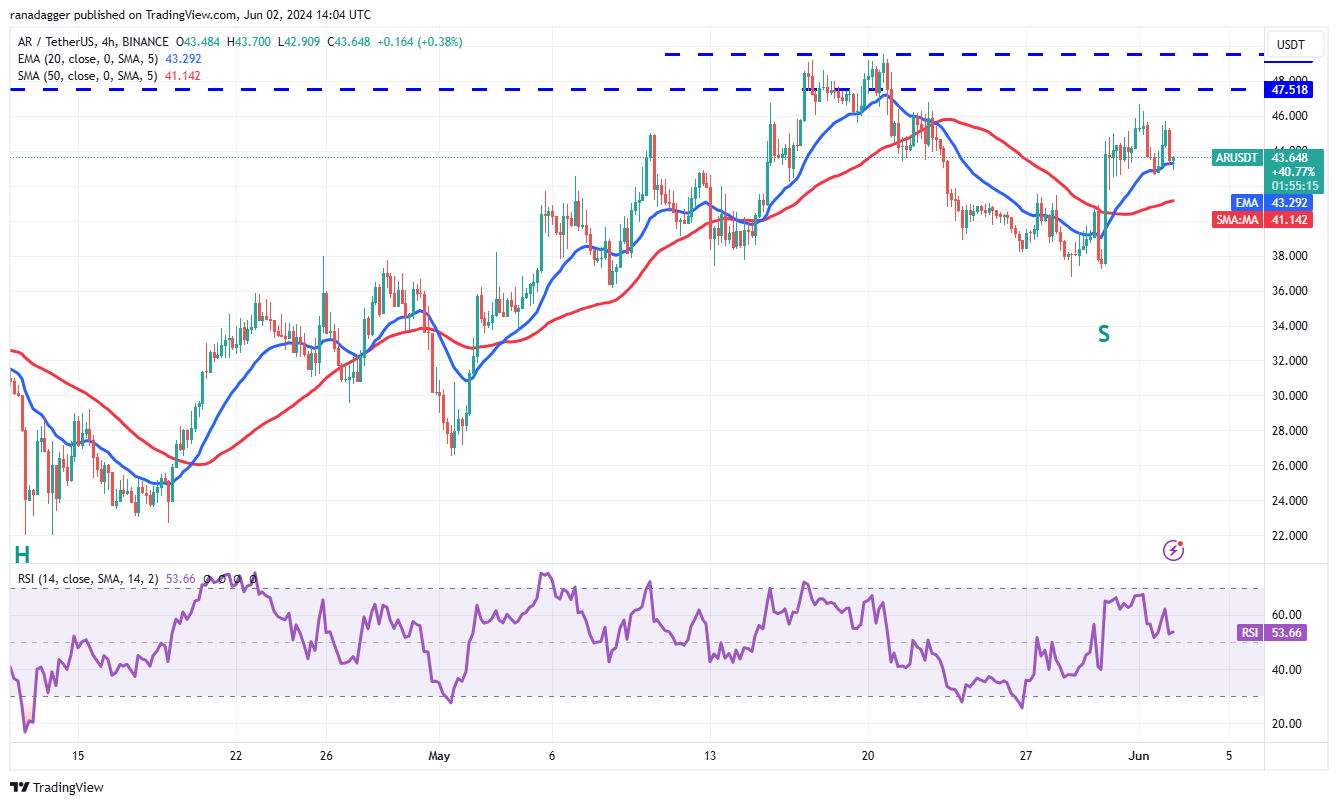
The price turned down from the overhead resistance of $47.51 but found support at the 20-EMA on the 4-hour chart. This suggests that the bulls are trying to defend the 20-EMA. The bulls will once again attempt to overcome the overhead obstacle. If they succeed, the pair is likely to pick up momentum and surge to $57.
If bears want to prevent the upside, they will have to drag AR price below the moving averages. If they do that, the bullish momentum will weaken, and the pair may decline to $37.
Related: 3 signs that Ethereum price will finally break $4K in June
Monero price analysis
Monero (XMR) has been climbing higher steadily for the past few days. XMR price rose above the downtrend line on June 1, indicating that the correction could be ending.
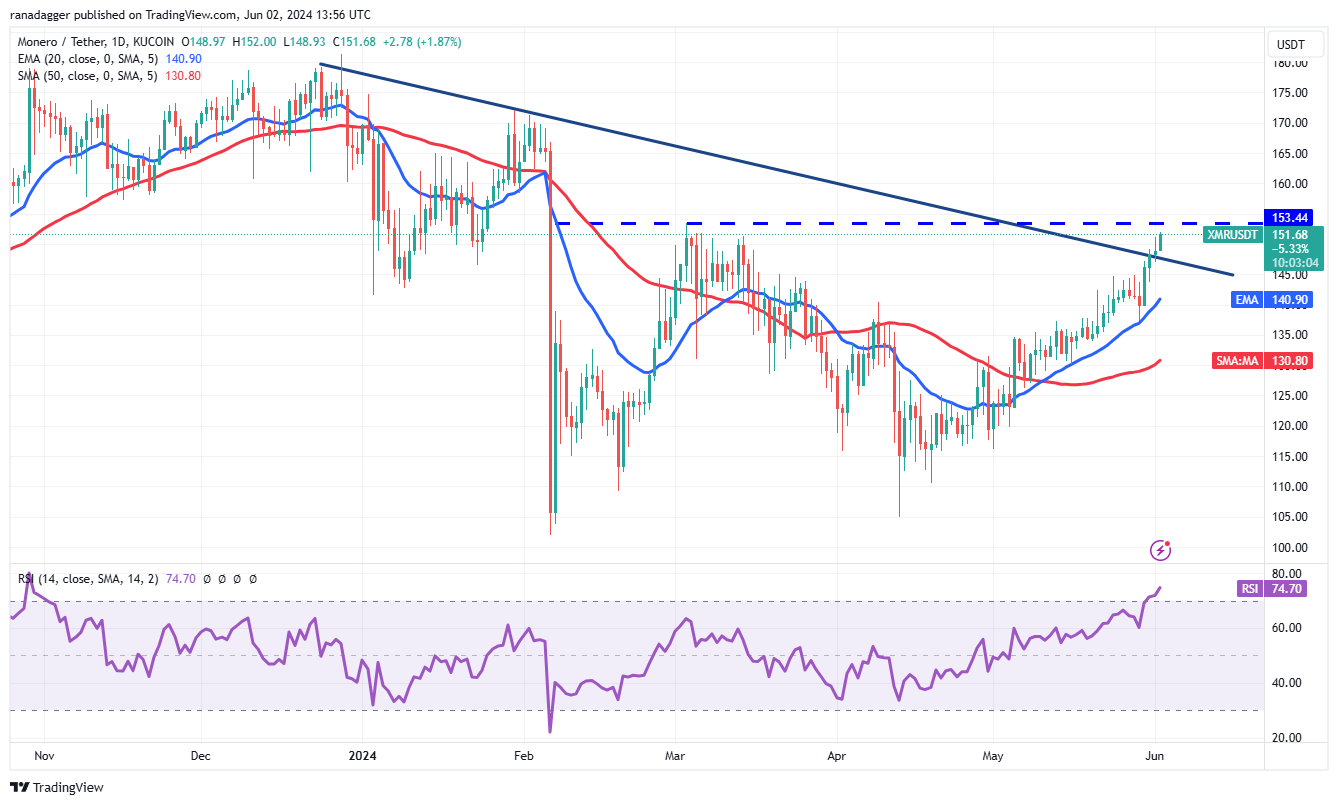
The up move may face strong selling near $153.44, but the bulls are expected to buy the dips to the 20-day EMA ($140.90). If they do that, the possibility of a break above the overhead resistance increases. The XMR/USDT pair could then attempt a rally to $170.
On the contrary, if the price turns down sharply and breaks below the 20-day EMA, it will signal that the bulls are rushing to the exit. That could start a deeper correction to the 50-day SMA ($130.80).
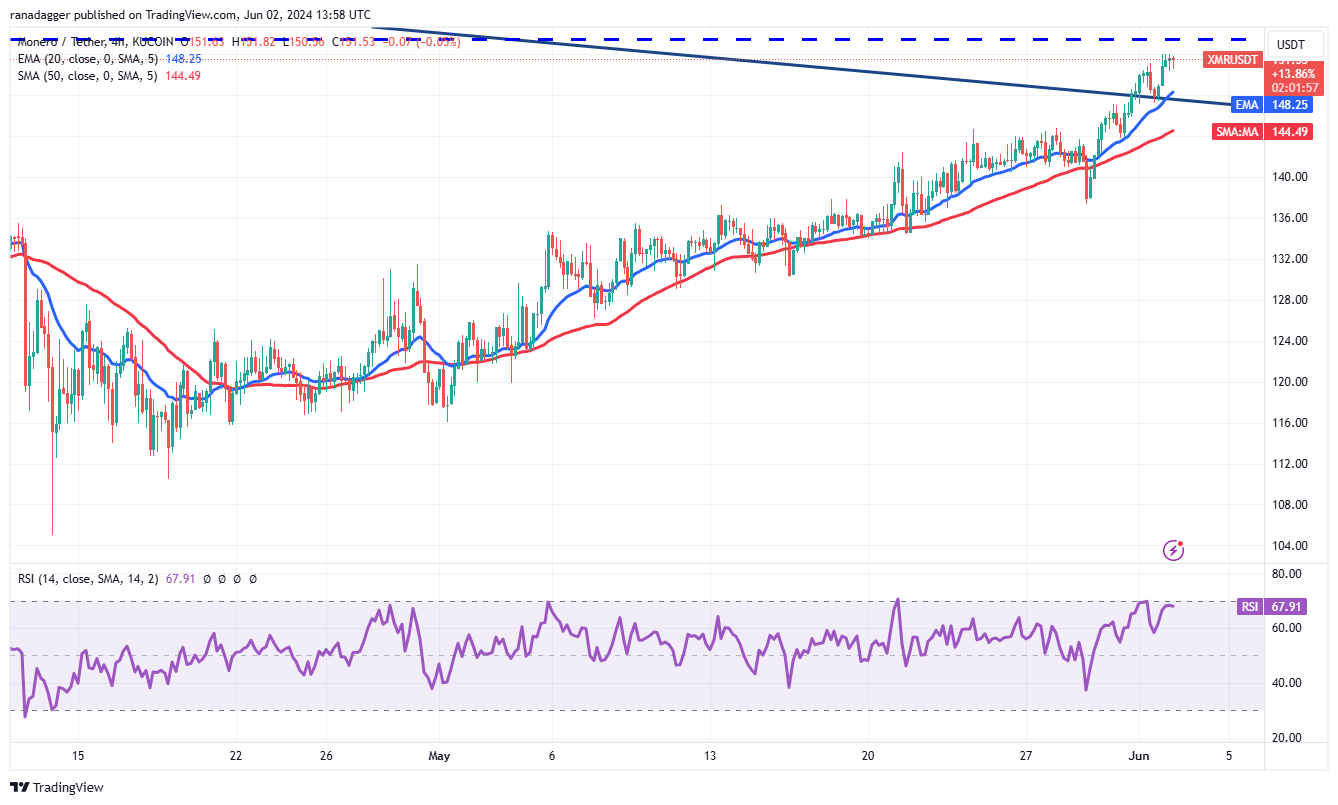
The 4-hour chart shows that the pair has been gradually moving higher, but the bulls are likely to face stiff resistance at $153.44. If the price turns down from $153.44 but finds support at the moving averages, it will signal that the sentiment remains bullish. The buyers will then make one more attempt to surmount the overhead barrier.
On the downside, the moving averages are the key support level to watch out for. A break and close below the 50-SMA could signal the start of a deeper correction. The pair may descend to $137 and subsequently to $130.
Celestia price analysis
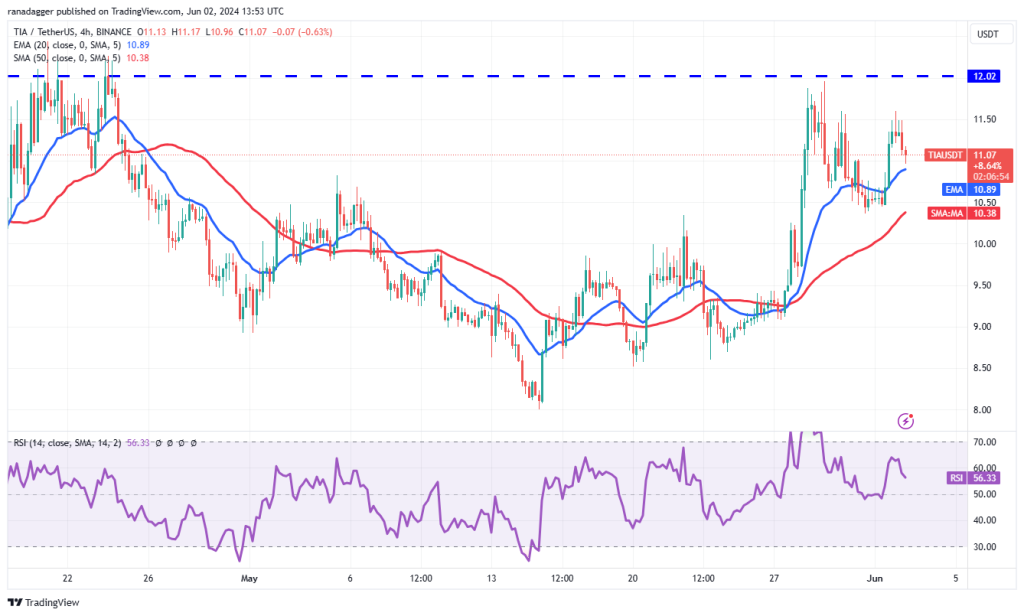
Celestia (TIA) has been staying above the moving averages for the past few days, suggesting that the bulls are trying to start a new up move.
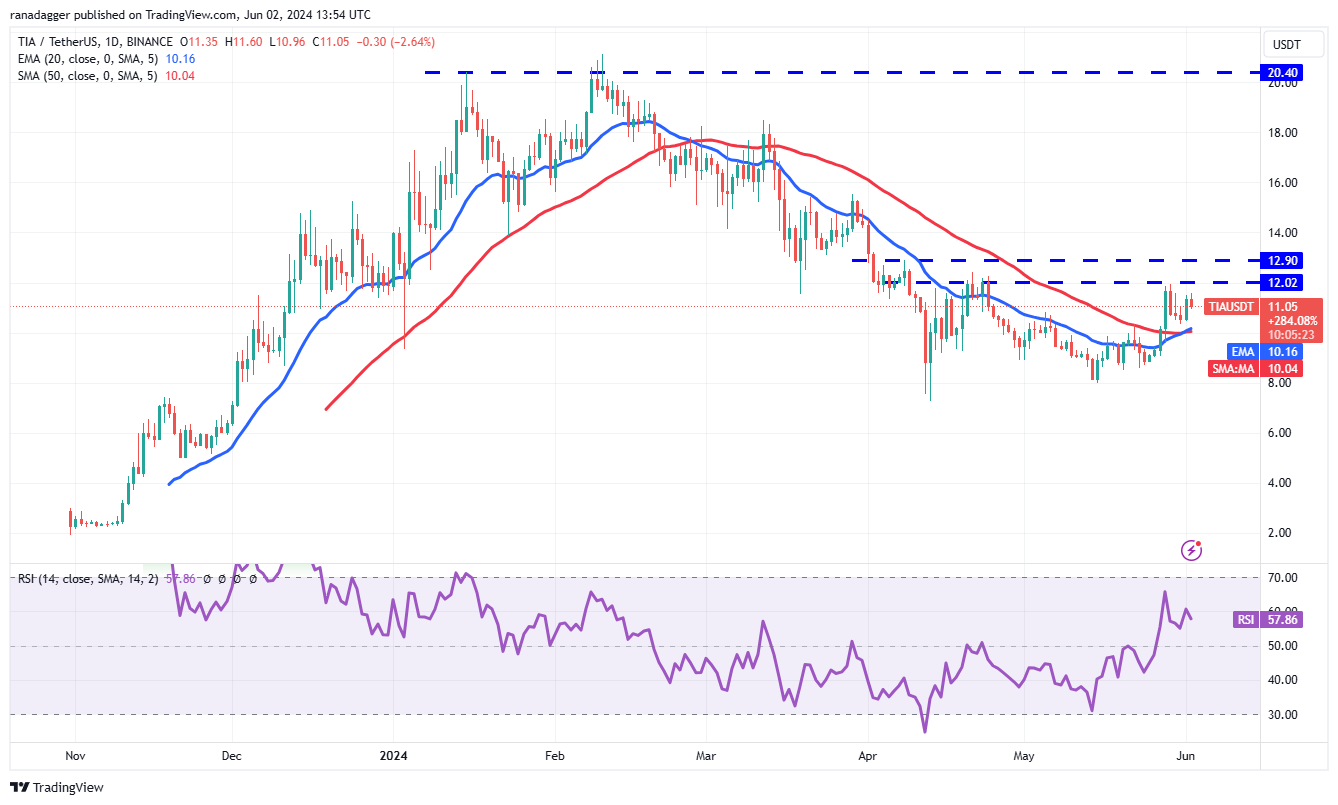
The moving averages have completed a bullish crossover, and the RSI is in the positive territory, signaling that the bulls are at an advantage. Buyers will have to drive the price above the $12.02 to $12.90 overhead zone to indicate the start of a new up move. The TIA/USDT pair could rally to $15.50 and later to $18.50.
If the bulls fail to shove the price above the overhead zone, it will suggest that the bears are active at higher levels. A break below the moving averages could keep the pair inside a range for some time.
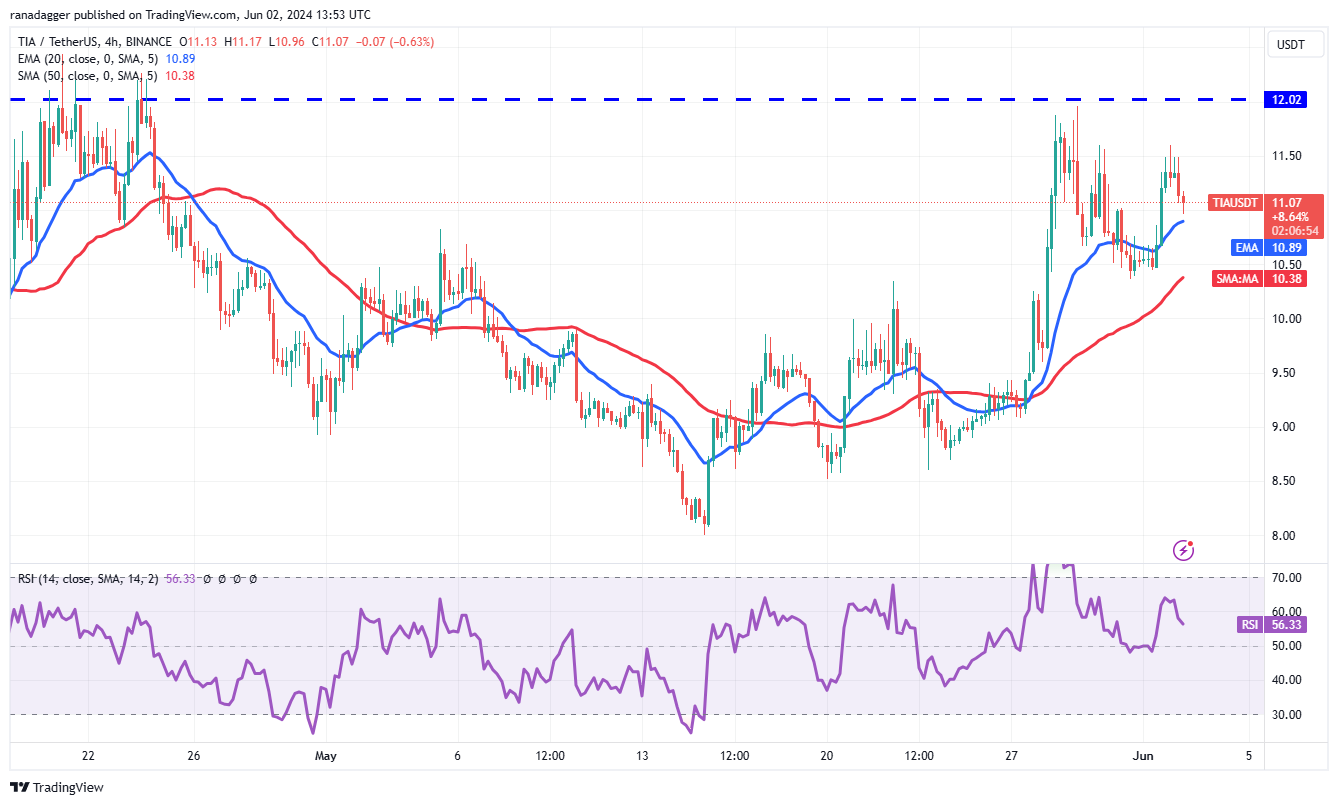
The 4-hour chart shows that the pair turned down from the near-term resistance of $11.60 and reached the 20-EMA. A strong rebound off the 20-EMA will suggest demand at lower levels. The pair can then climb to the overhead resistance of $12.02.
Instead, if the price continues to fall lower below the 20-EMA, it will signal that the bullish momentum is weakening. The pair may then slump to the 50-SMA, which is likely to act as a strong support.
This article does not contain investment advice or recommendations. Every investment and trading move involves risk, and readers should conduct their own research when making a decision.




Responses