Ethereum price in ‘bull market’ after spot ETH ETF approvals greenlight rally toward $4K
With the spot ETH ETFs approved, traders are confident that Ethereum price is ready to rally well above $4,000.

Traders continue to push Ether (ETH) price closer to $4,000 on May 27, with the altcoin registering a 3.5% gain for the day.
Data from Cointelegraph Markets Pro and TradingView shows strong performance from Ether which rose from a low of $3,048 on May 20, climbing 27% to reach a 10-week high of $3,964 on May 27.
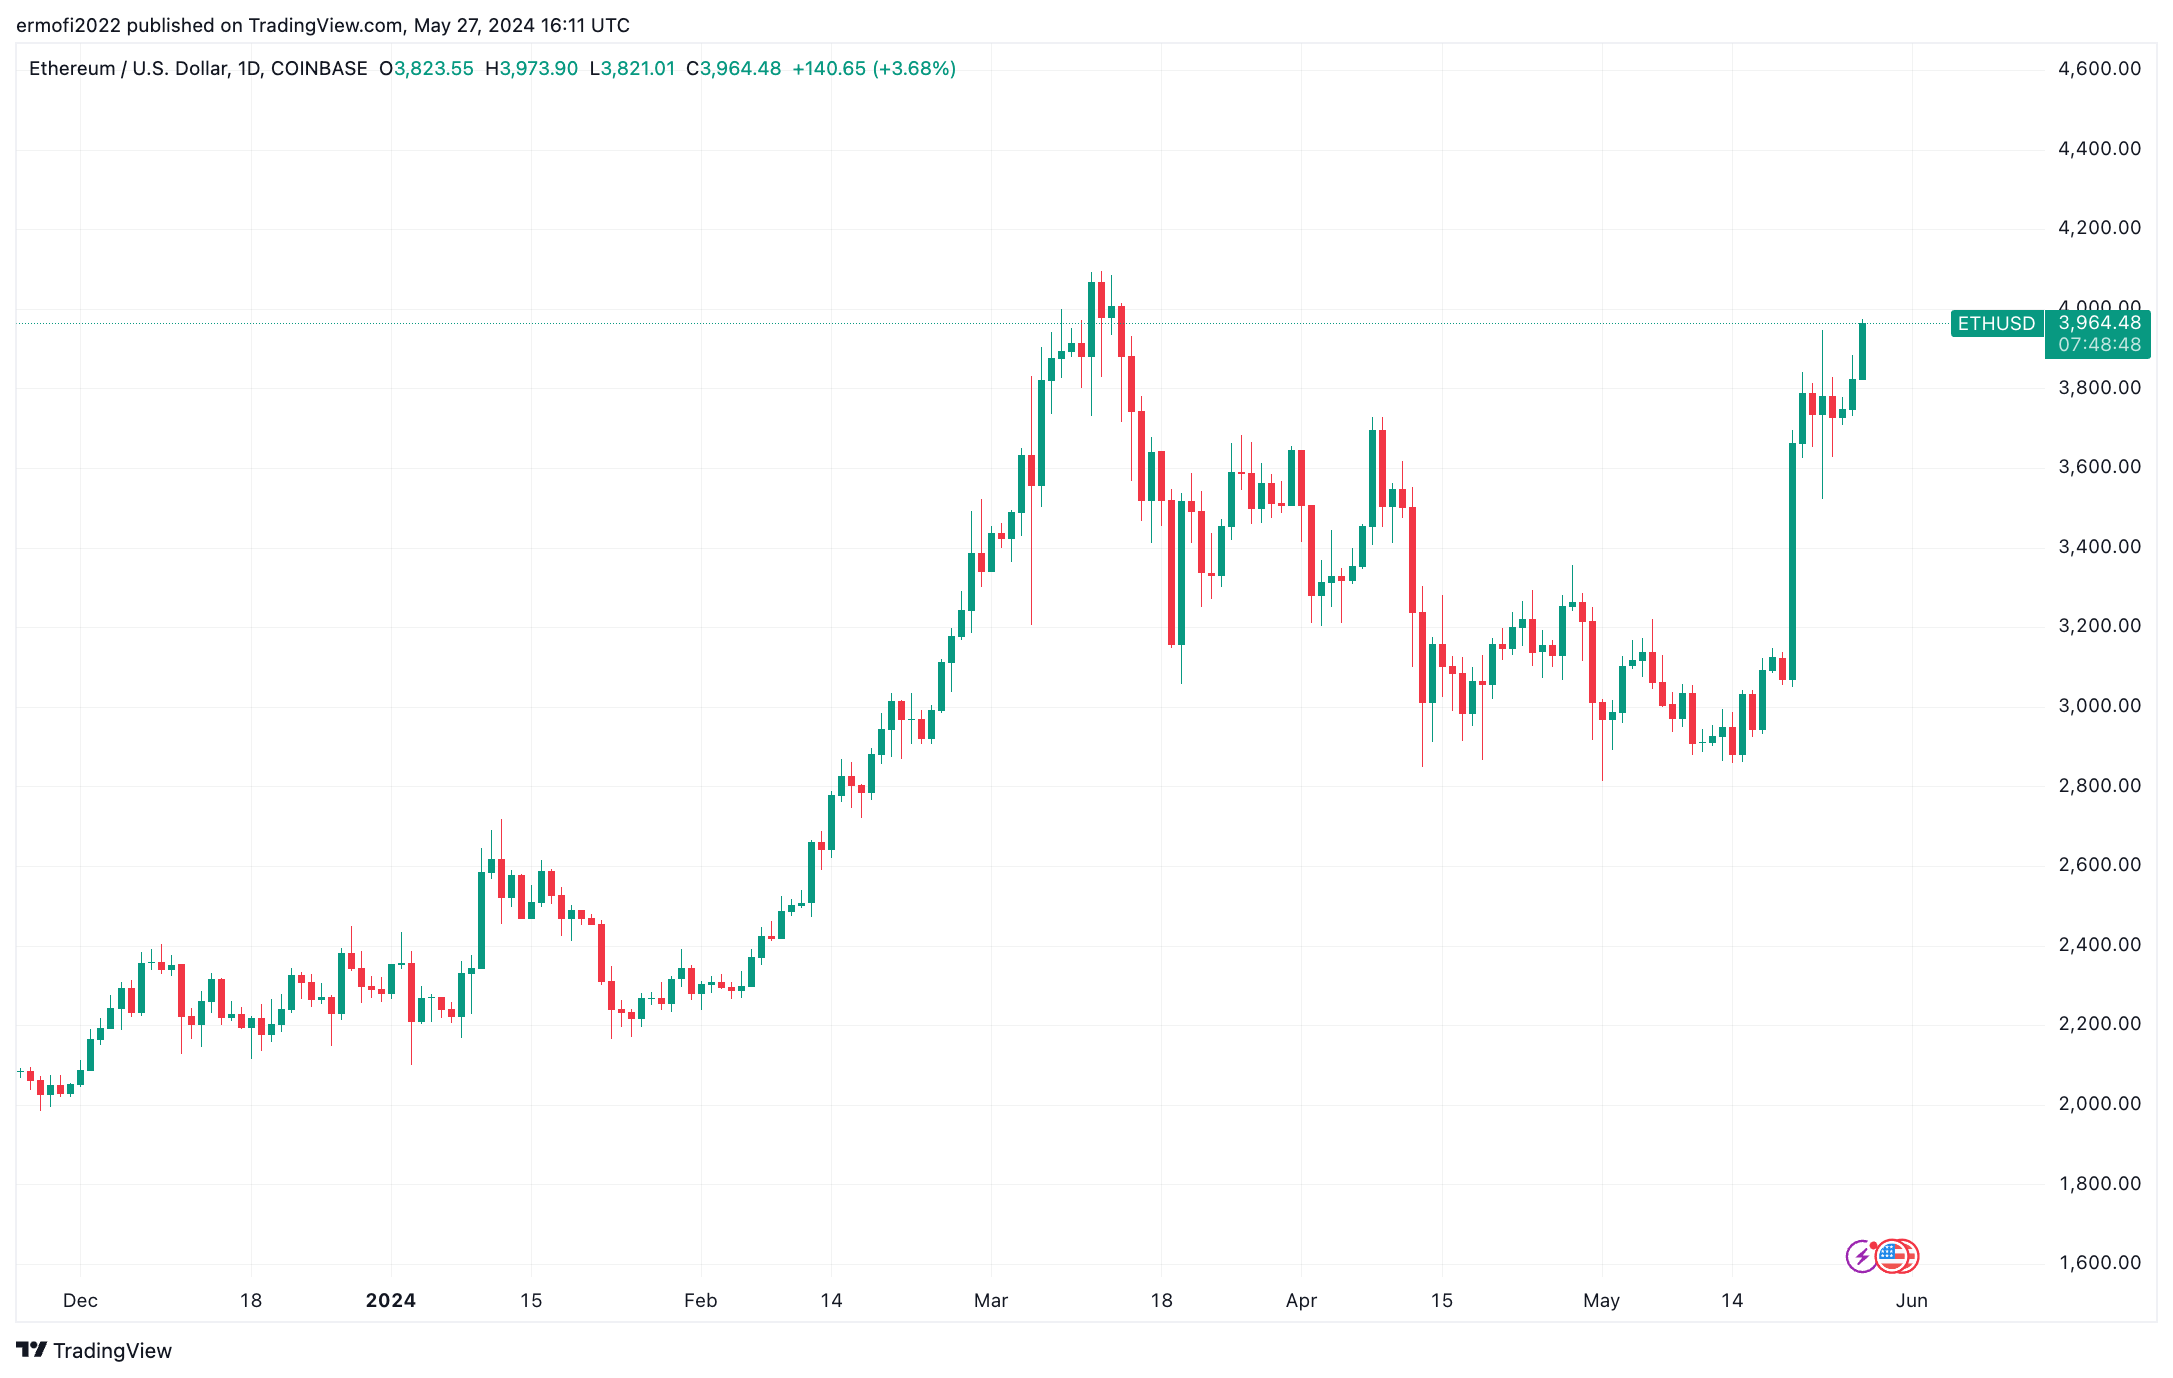
Ether’s performance over the last seven days has largely been driven by the markets’ anticipation that the spot Ethereum exchange-traded funds (ETFs) in the United States would be approved. Even though ETH displayed a lackluster performance after the approval, the move toward $4,000 is viewed as significant.
Crypto analyst Jelle said that Ether has completed a long period of accumulation and with the spot Ethereum ETFs approved, the price is ready to enter the “stratosphere.”
Though it “took much longer than anticipated,” market participants are “finally seeing bull-market ethereum again,” Jelle explained in a May 27 post on X.
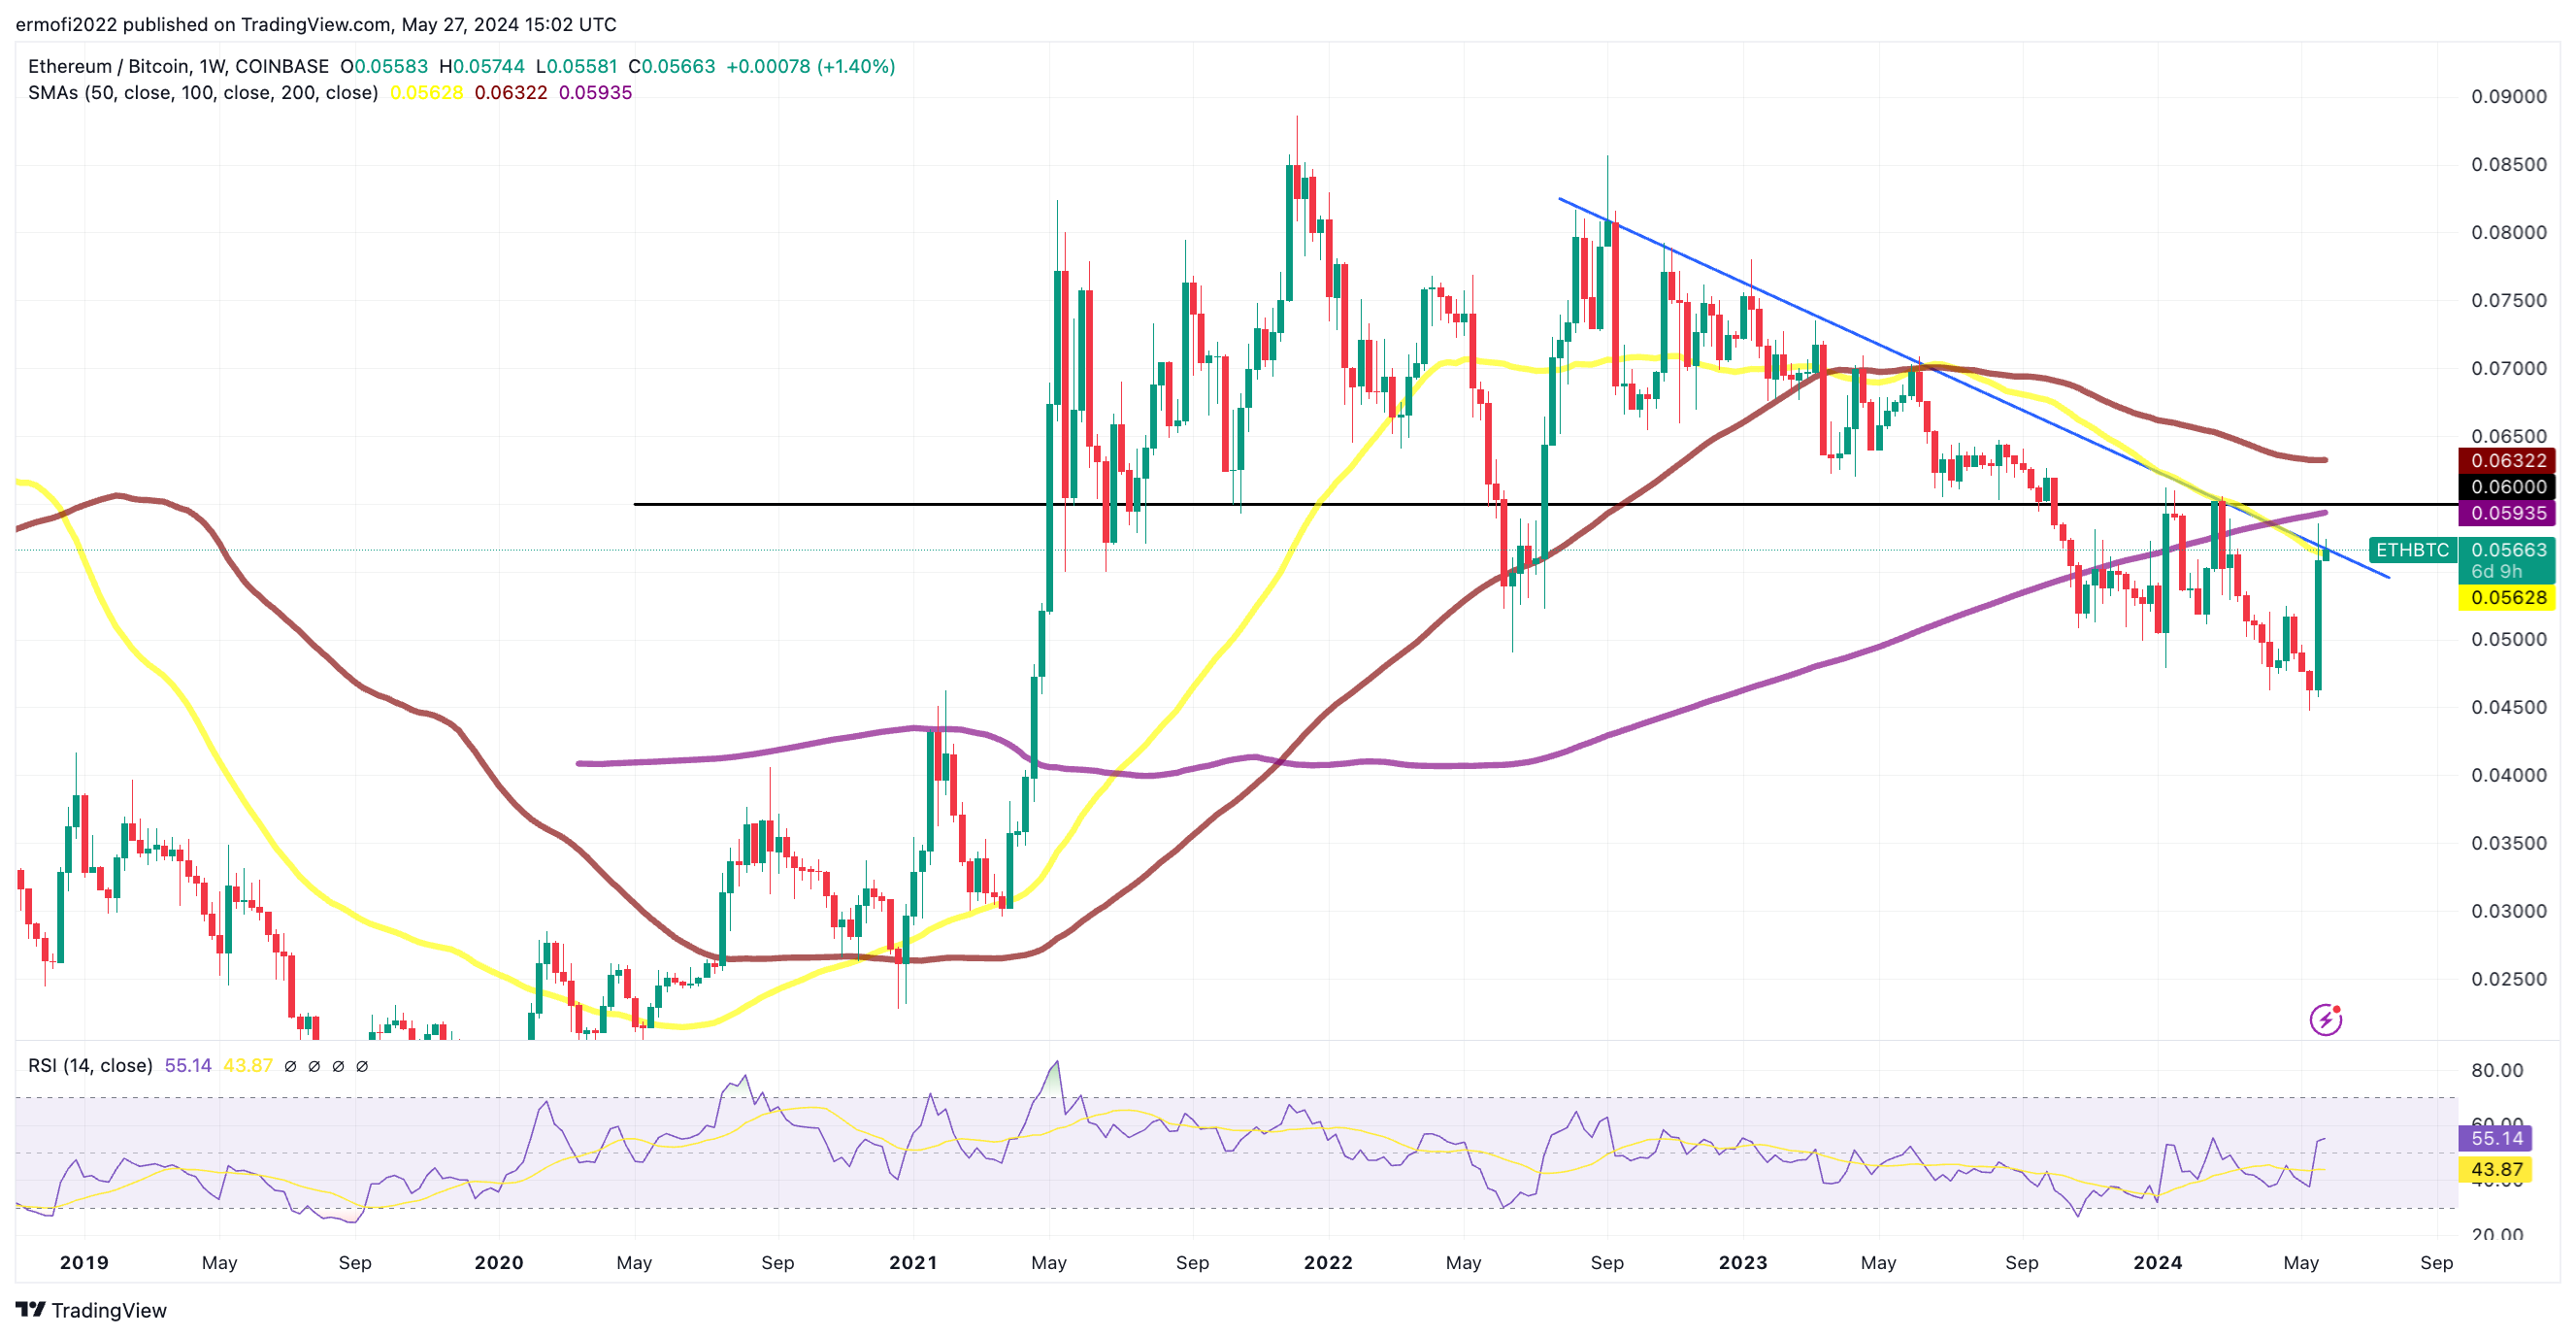
Analyst and founder of MN Capital Michaël van de Poppe made similar observations using a weekly ETH/BTC chart. According to van de Poppe, the weekly relative strength index (RSI) had produced a bullish divergence, signifying the start of capital rotation from Bitcoin (BTC) into altcoins after an extended crypto winter.
“The chances are significant that the 2.5-year bear market is finally over for Ethereum.”
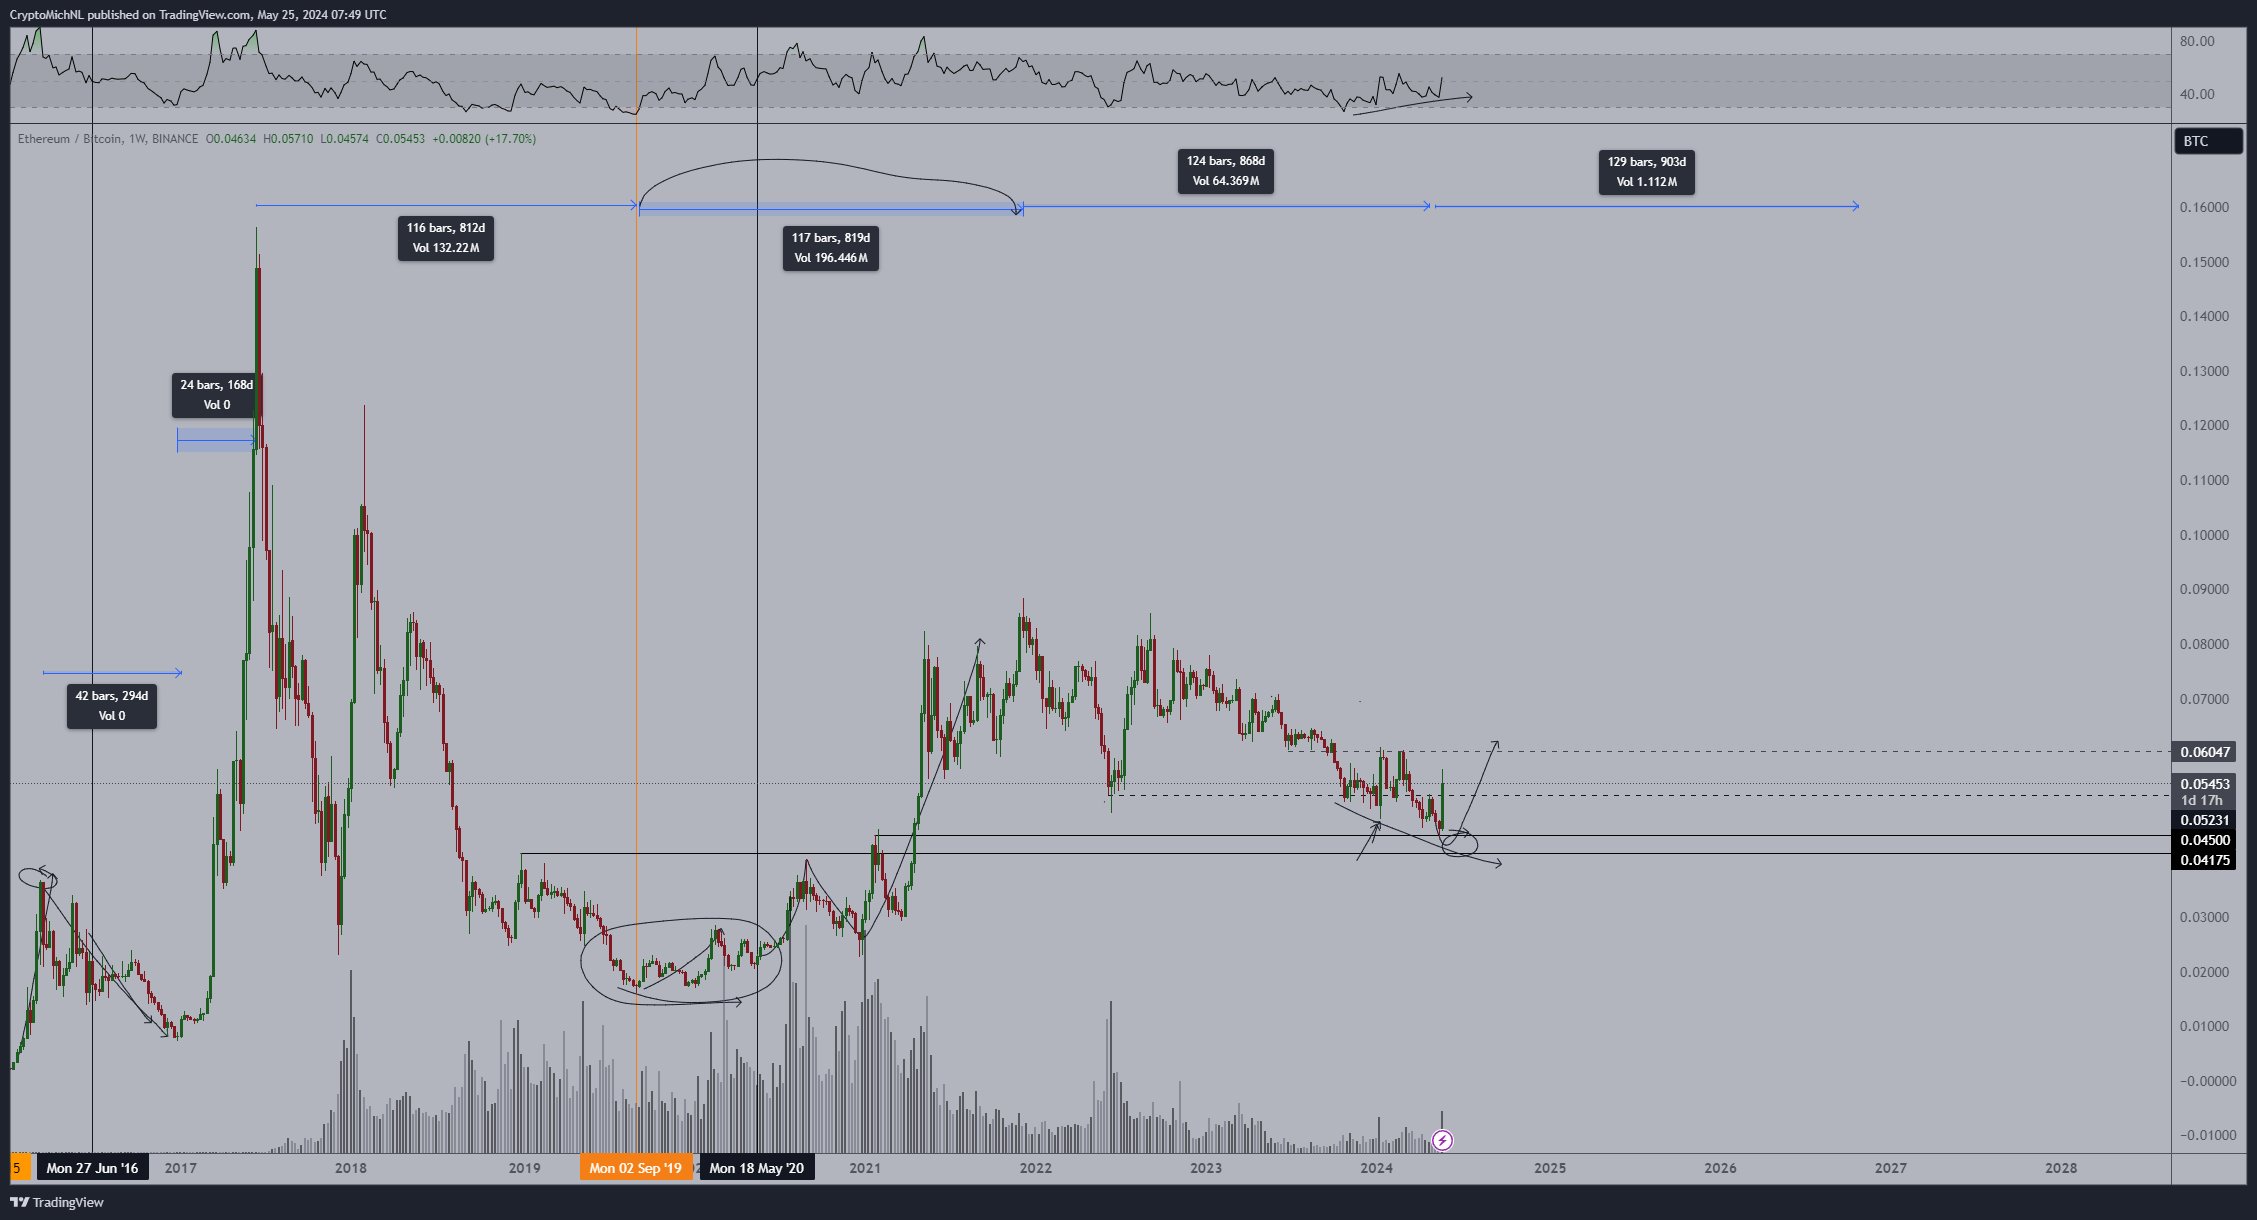
“#ETH confirms a bullish divergence and a break of the downtrend, ” crypto trader Matthew Hyland declared in a May 27 post on X, adding that an increase in trading volume would “further validate the breakout.”
Fellow analyst Tuur Demeester believes that the Ethereum market euphoria has yet to materialize. In a May 25 post on X, Demeester shared the following chart: The ETH/BTC pair “needs to breach 0.06 to turn bullish.”
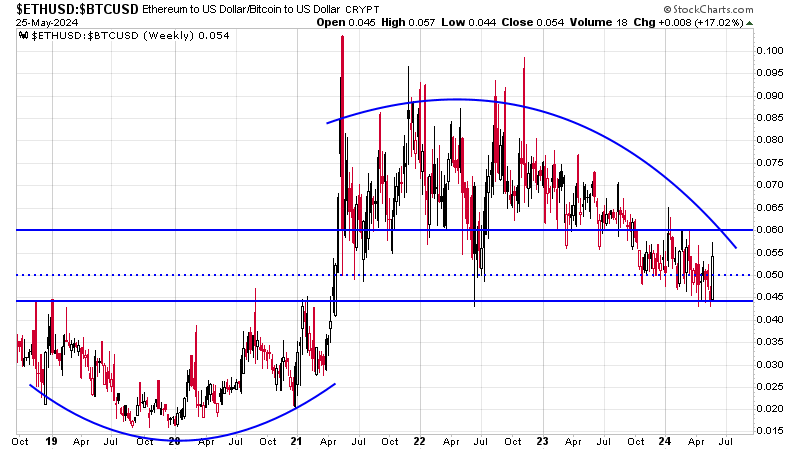
It is worth noting that the ETH/BTC pair was trading at 0.056 at the time of publication, with the 50-week simple moving average (SMA) providing immediate support.
The price was required to hold this support to increase the chances of flipping the long-term descending trendline (blue) into support. If this happens, ETH/BTC will rise to confront resistance from the 0.06 level embraced by the 200-week SMA.
The chart below shows that breaching this level doesn’t mean that the pair is out of the woods yet. It will still have to flip the 100-week SMA at 0.063 to confirm the breakout.
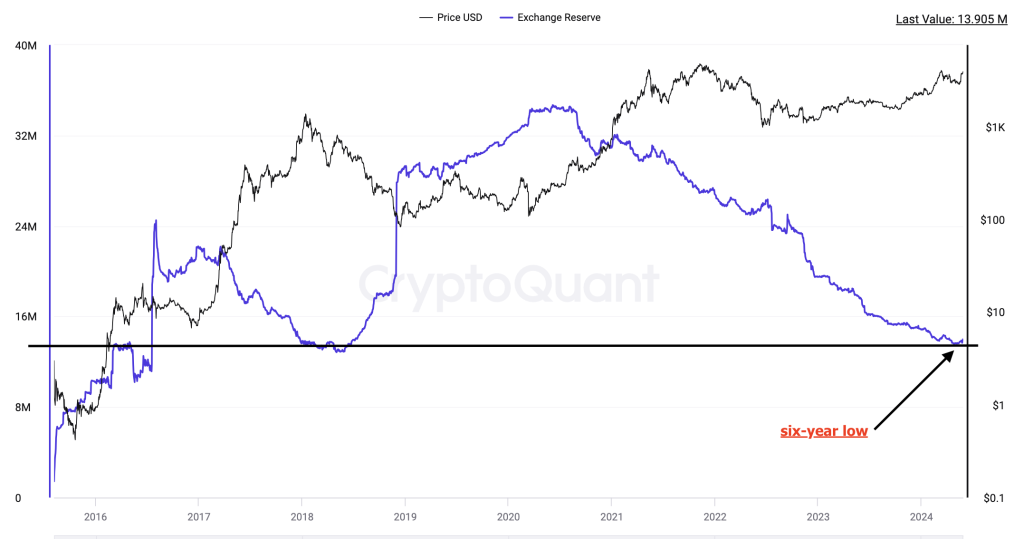
Meanwhile, data from on-chain metrics provider CryptoQuant shows ETH balance on exchanges has been decreasing over the last 12 months to reach a six-year low of 13.58 million ETH on May 20.
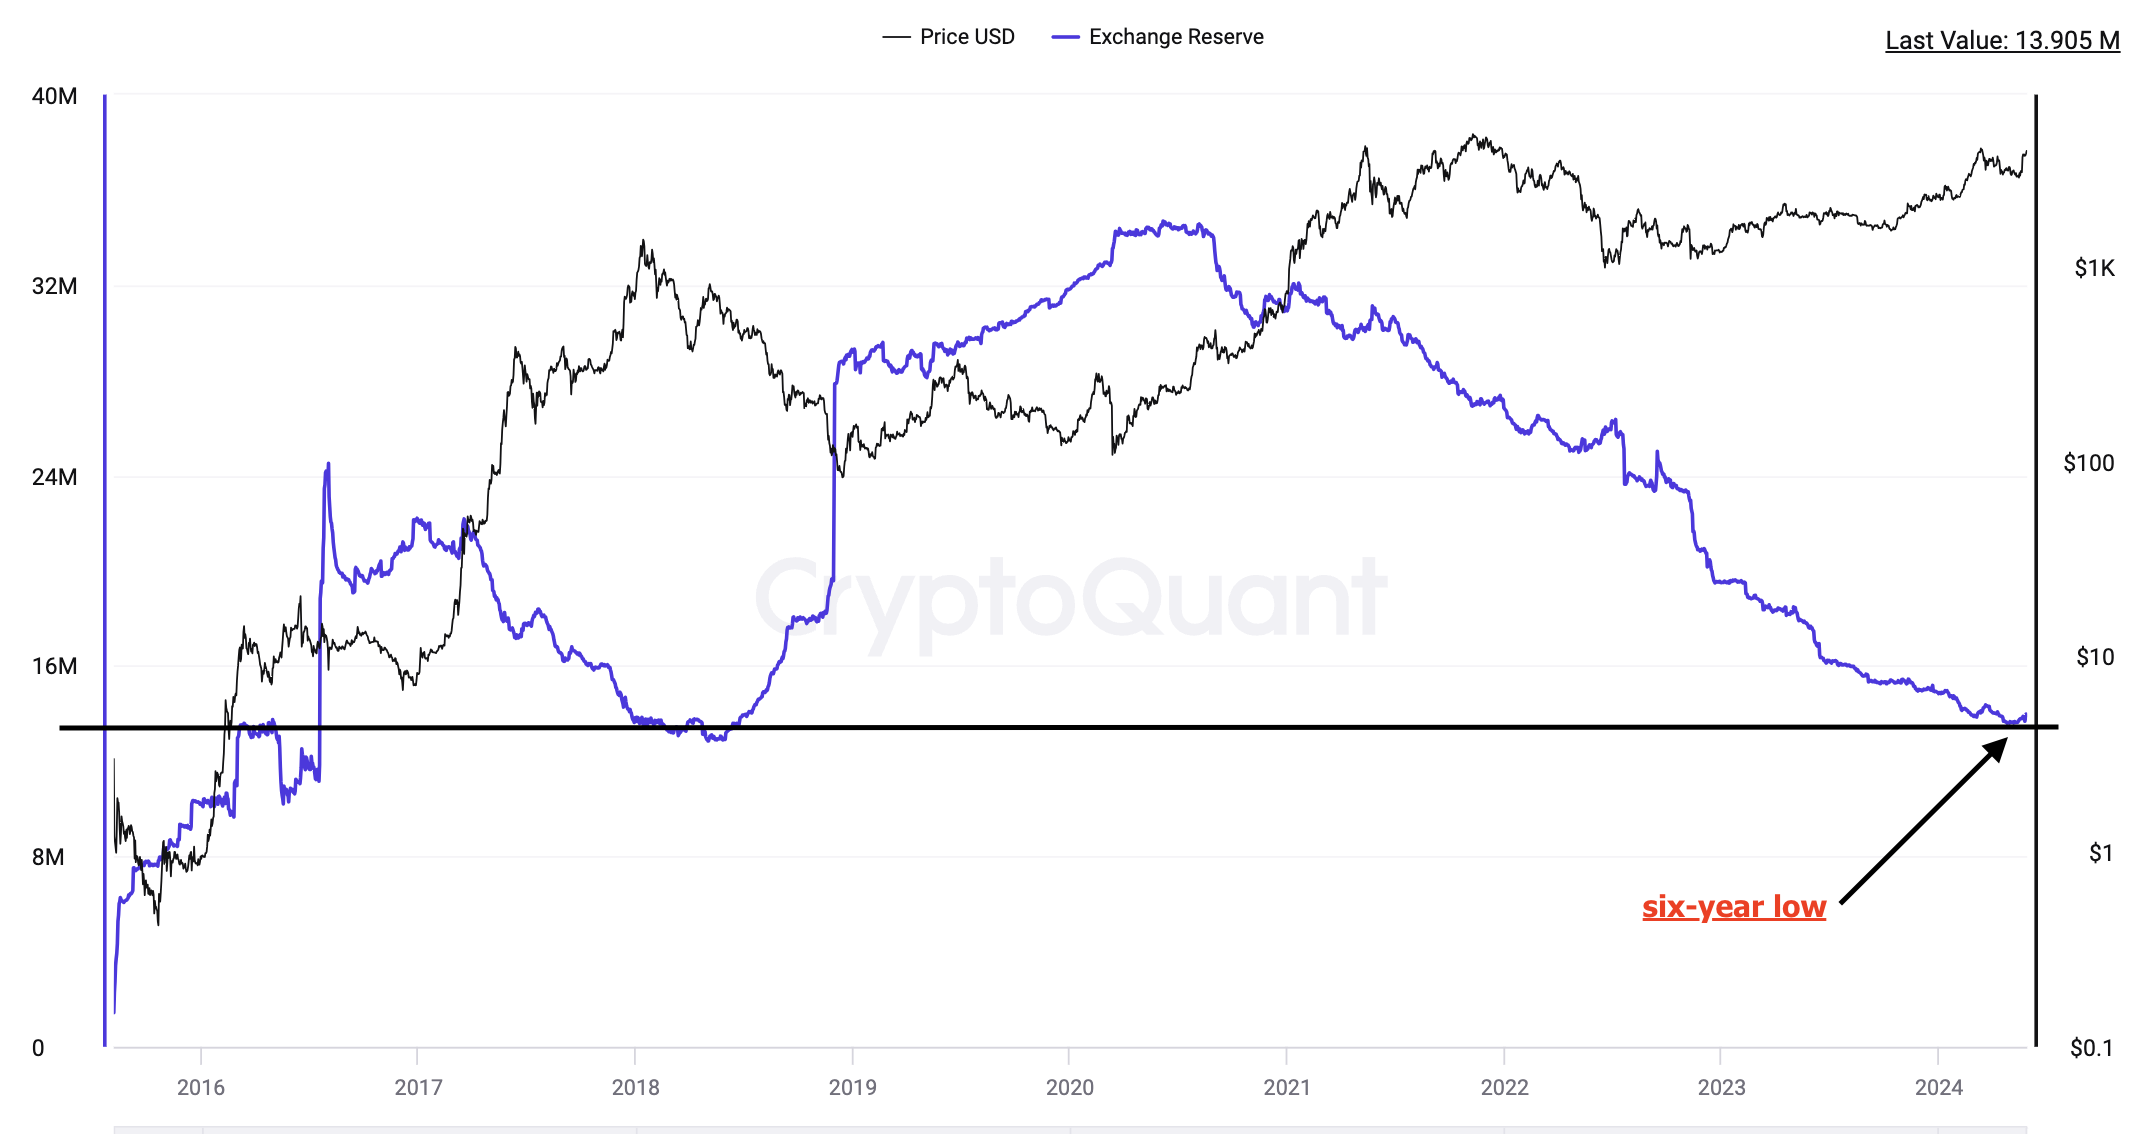
The decreasing Ether balance on exchanges signifies traders’ adoption of long-term investment strategies, indicating increased confidence in the long-term potential and value of Ether.





Responses