Bitcoin’s range-bound action puts eyes on NEAR, AR, CORE and BONK
Bitcoin’s range-bound price action could lead traders to focus on NEAR, AR, CORE and BONK.

Bitcoin (BTC) attempted to start a relief rally this week but met with intense selling pressure near $67,000. The largest cryptocurrency by market capitalization is on track to end the week with a minor loss of about 2%.
Popular trader and analyst Rekt Capital believes that Bitcoin has “entered the Post-Halving ‘Danger Zone’” where it could see a further dip within the next two weeks. Another negative in the near term is the net outflows from the spot Bitcoin exchange-traded funds. Farside Investors reported that the ETFs witnessed a net outflow of $218 million on April 25, after a $120 million outflow the previous day.
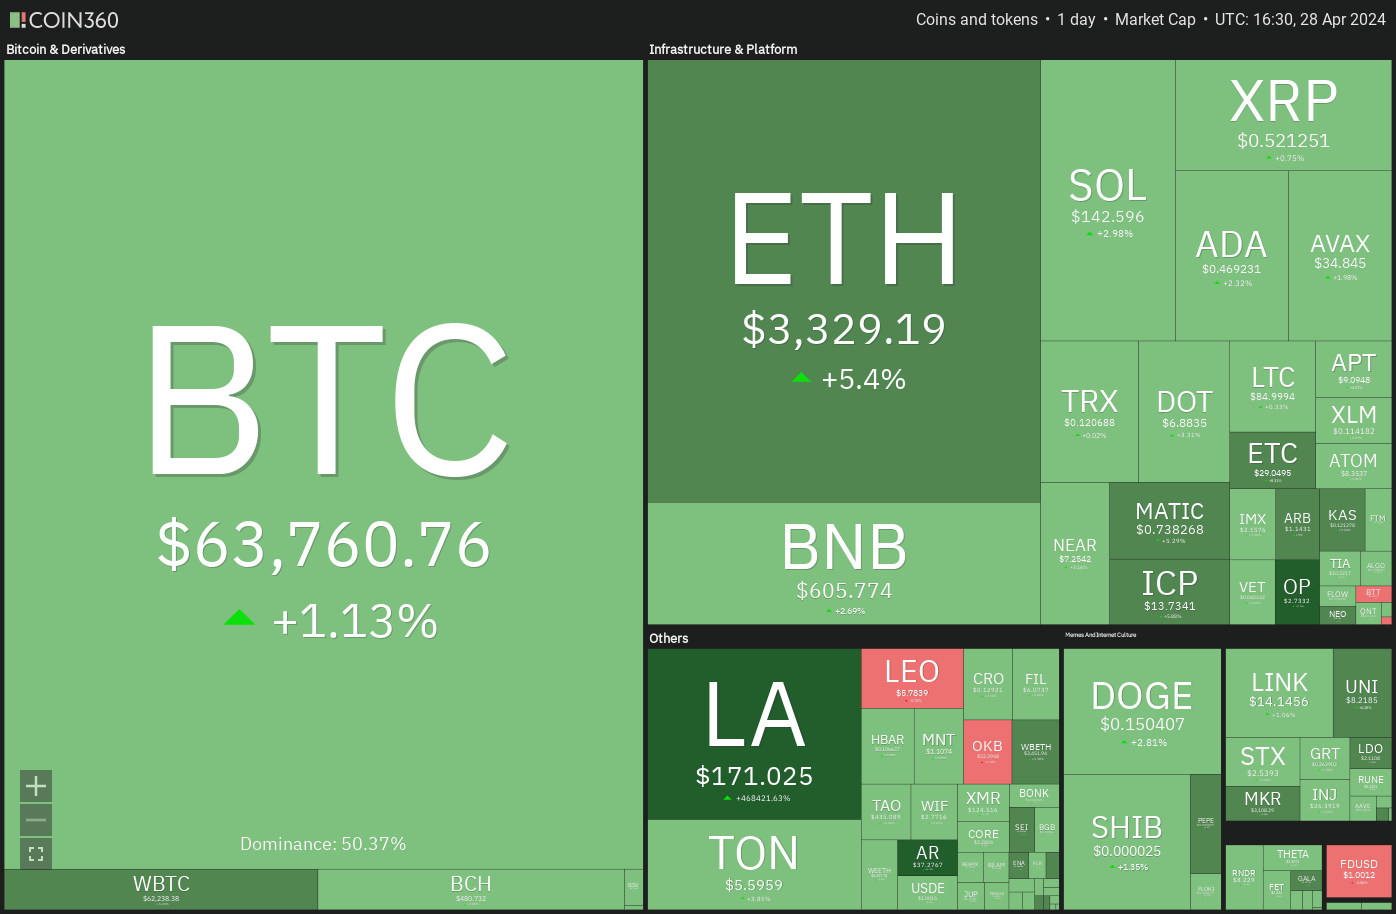
When the price trades in a large range, it is difficult to predict the direction of the breakout with certainty. Traders could buy near the support and sell at the resistance by keeping a suitable stop loss, or stay on the sidelines until a breakout happens.
Will Bitcoin and altcoins stay above their respective support levels and start a relief rally?
Let’s study the top 5 cryptocurrencies that look strong on the charts and may start the recovery.
Bitcoin price analysis
Bitcoin has been range-bound between $59,600 and $73,777 for several days, indicating indecision between the bulls and the bears about the next directional move.
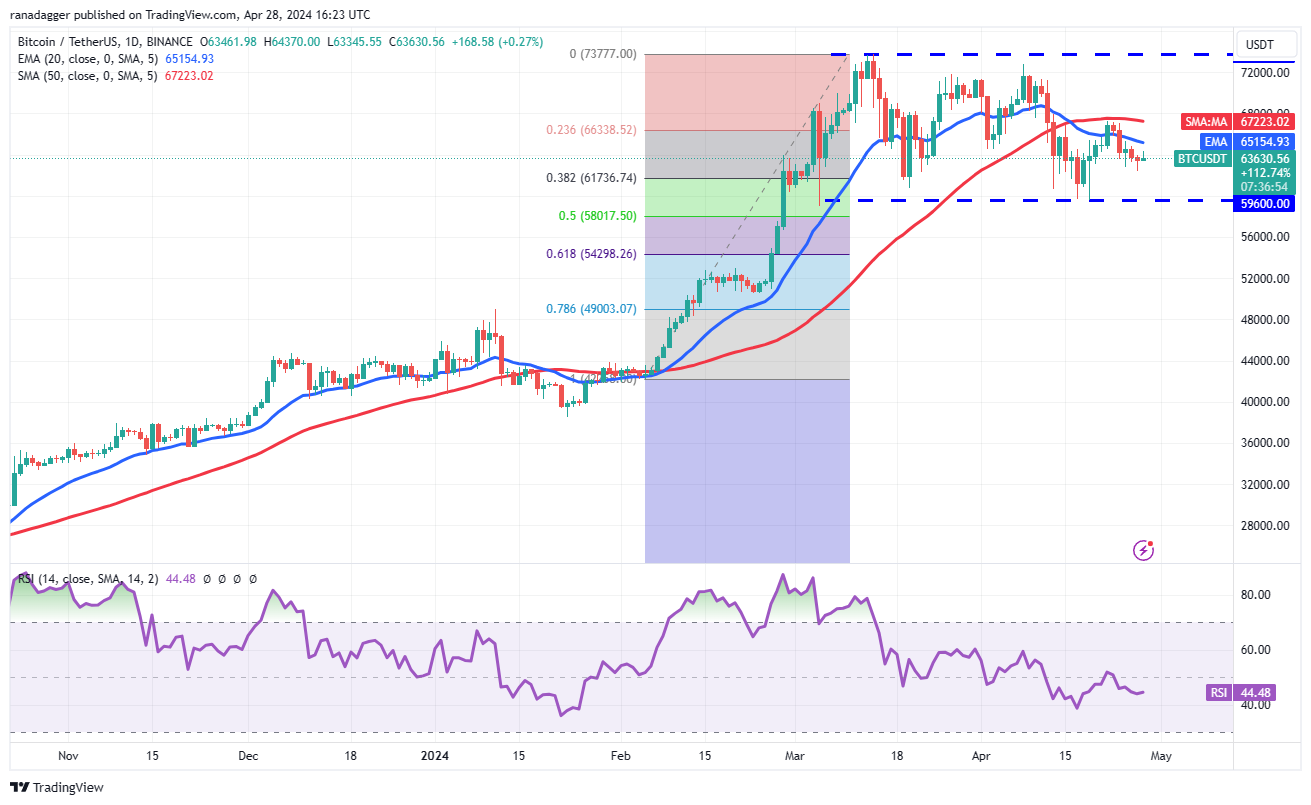
Generally, in a range, traders buy near the support and sell close to the resistance. The bulls are expected to aggressively defend the $59,600 level as a break below it could deepen the correction to 61.8% Fibonacci retracement level of $54,298. Such a move will delay the start of the next leg of the uptrend.
Contrarily, if the price turns up from the current level or the $59,600 support, it will suggest that bulls remain active at lower levels. The BTC/USDT pair may jump to $67,250 and later to the overhead resistance of $73,777. A break and close above this level will signal the start of the next leg of the uptrend to $84,000.
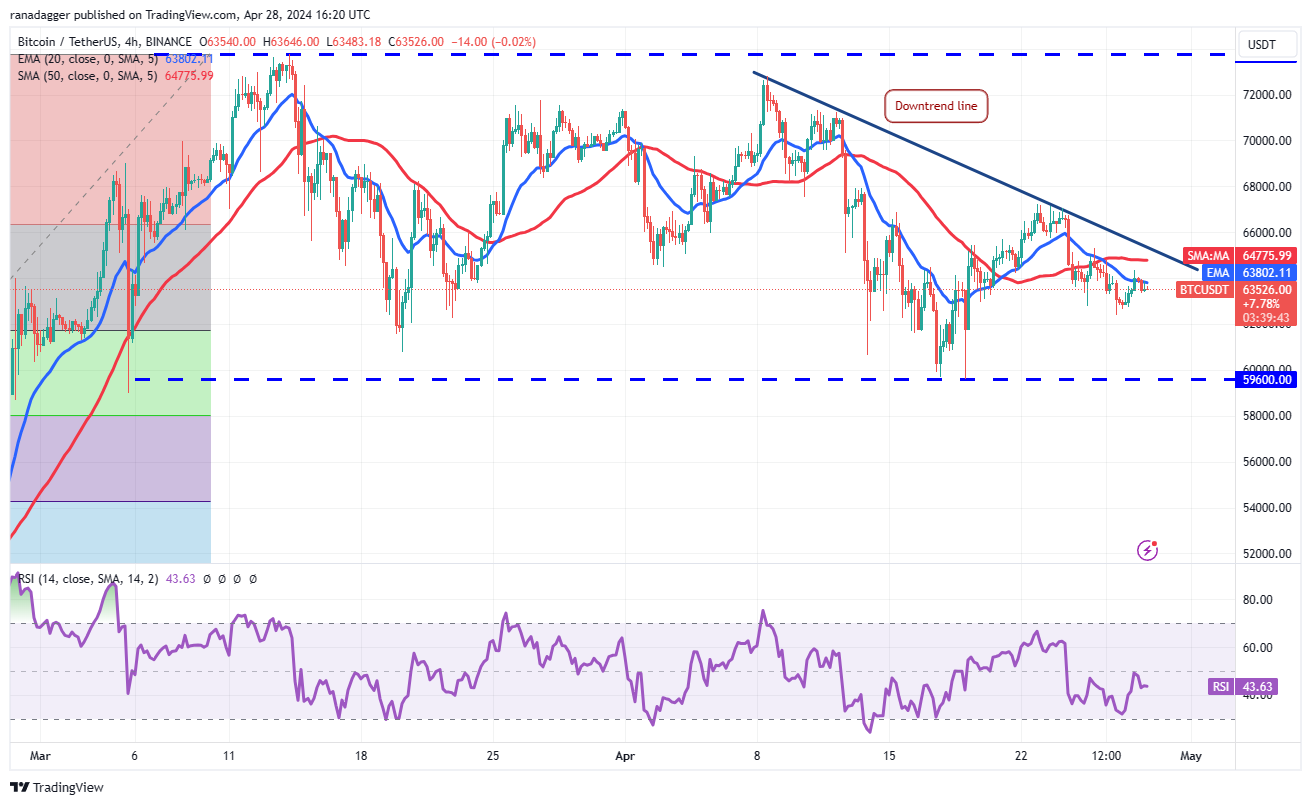
The flattish moving averages and the RSI just below the midpoint suggest a balance between supply and demand. The first sign of strength will be a break and close above the downtrend line. That could clear the path for a rise to $68,000 and then to $71,500.
Alternatively, if the price turns down from the current level or the downtrend line and breaks below $62,300, it will suggest that bears are in command. The pair could then skid to the crucial support at $59,600, where buyers are likely to step in.
Near Protocol price analysis
Near Protocol (NEAR) closed above the descending channel pattern on April 25, indicating that the downtrend could be ending.
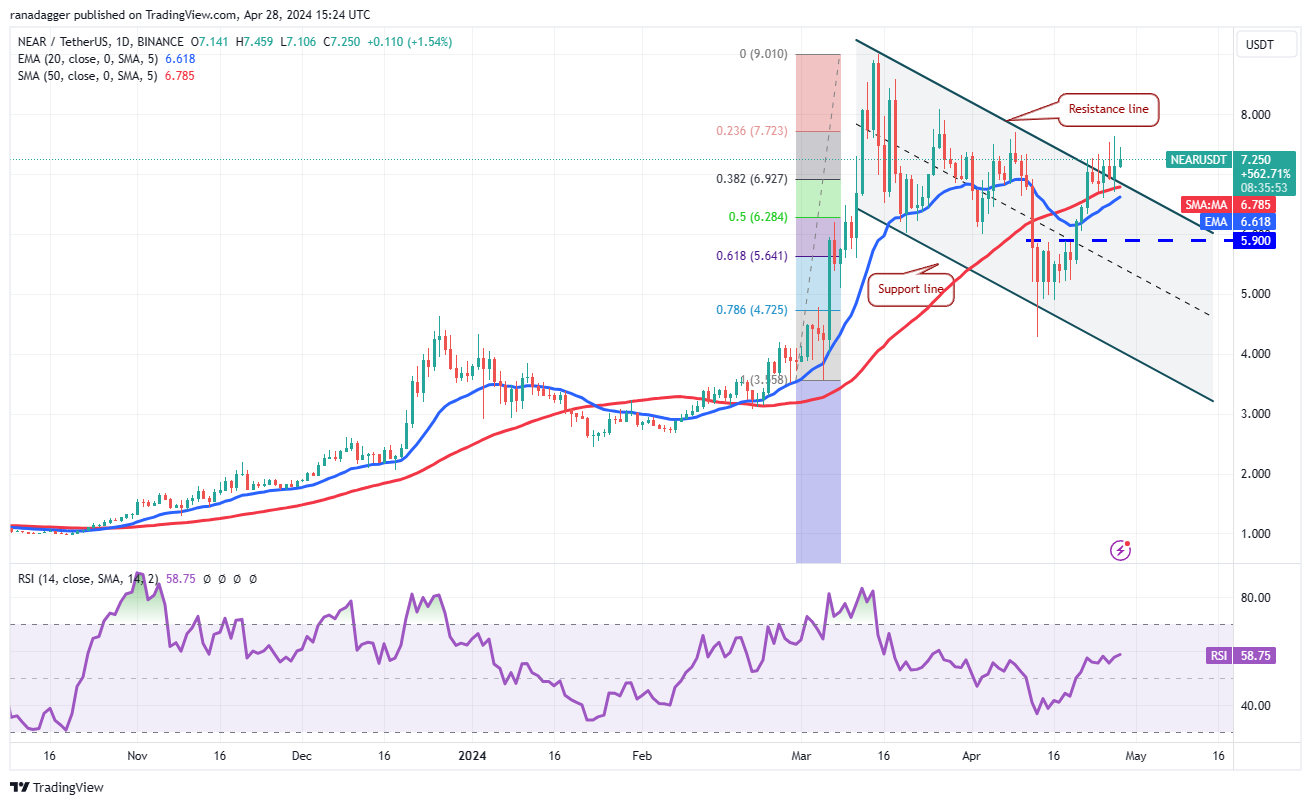
However, the bears have not given up and are selling near the immediate resistance at $7.70. If the price dips back into the channel, it will suggest that the breakout may have been a bull trap. That could pull the price down to $5.90.
Instead, if the price breaks above $7.70, it will suggest that the bulls are taking charge. The NEAR/USDT pair could then attempt a rally to $9., where the bears are likely to mount a strong defense.
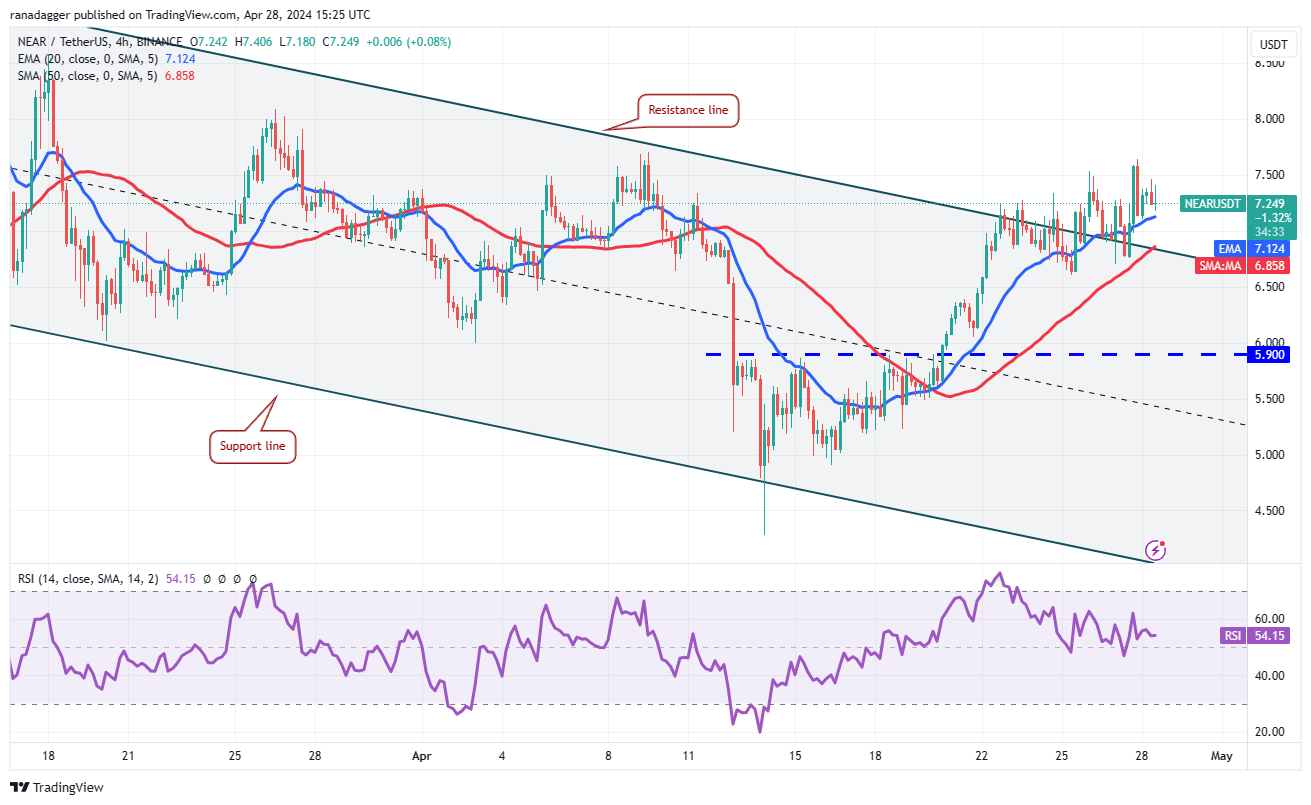
Both moving averages are sloping up, and the RSI is in the positive territory, indicating that the bulls have a slight advantage. Buyers are likely to face selling in the zone between $7.70 and $8.10, but if they bulldoze their way through, the rally could reach $9.
This optimistic view will be negated in the short term if the price turns down and breaks below $6.60. Such a move will indicate that the bears continue to sell on relief rallies. The pair may then slump to $5.90.
Arweave price analysis
Arweave (AR) rose above both moving averages on April 25, signaling that the bulls are attempting a comeback.
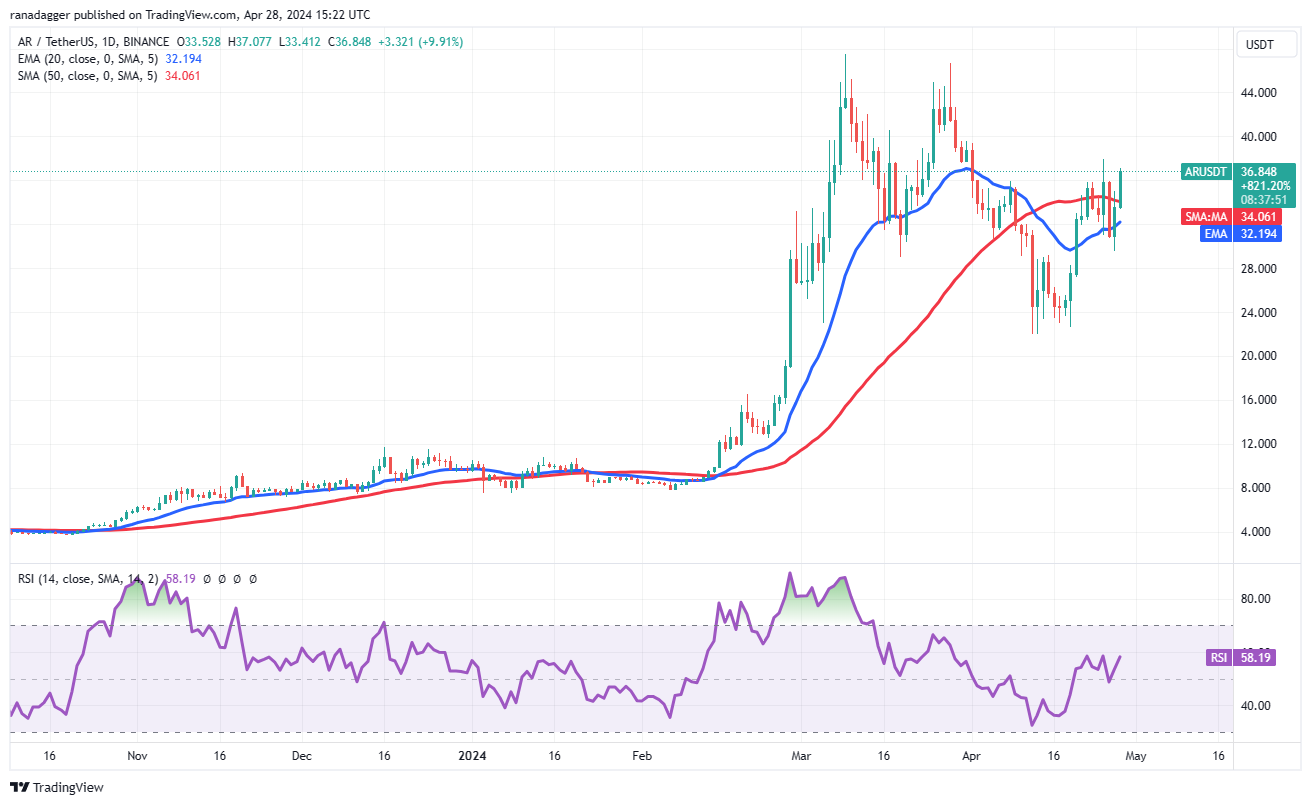
The bears tried to pull the price back, but the bulls purchased the dip to the 20-day EMA ($32.19) on April 27. This suggests a change in sentiment from selling on rallies to buying on dips. There is a minor resistance at $40, but if it is crossed, the AR/USDT pair could rally to the stiff overhead resistance of $47.52.
If bears want to prevent the rally, they will have to quickly tug the price back below the 20-day EMA. If they do that, the pair may tumble to $22.
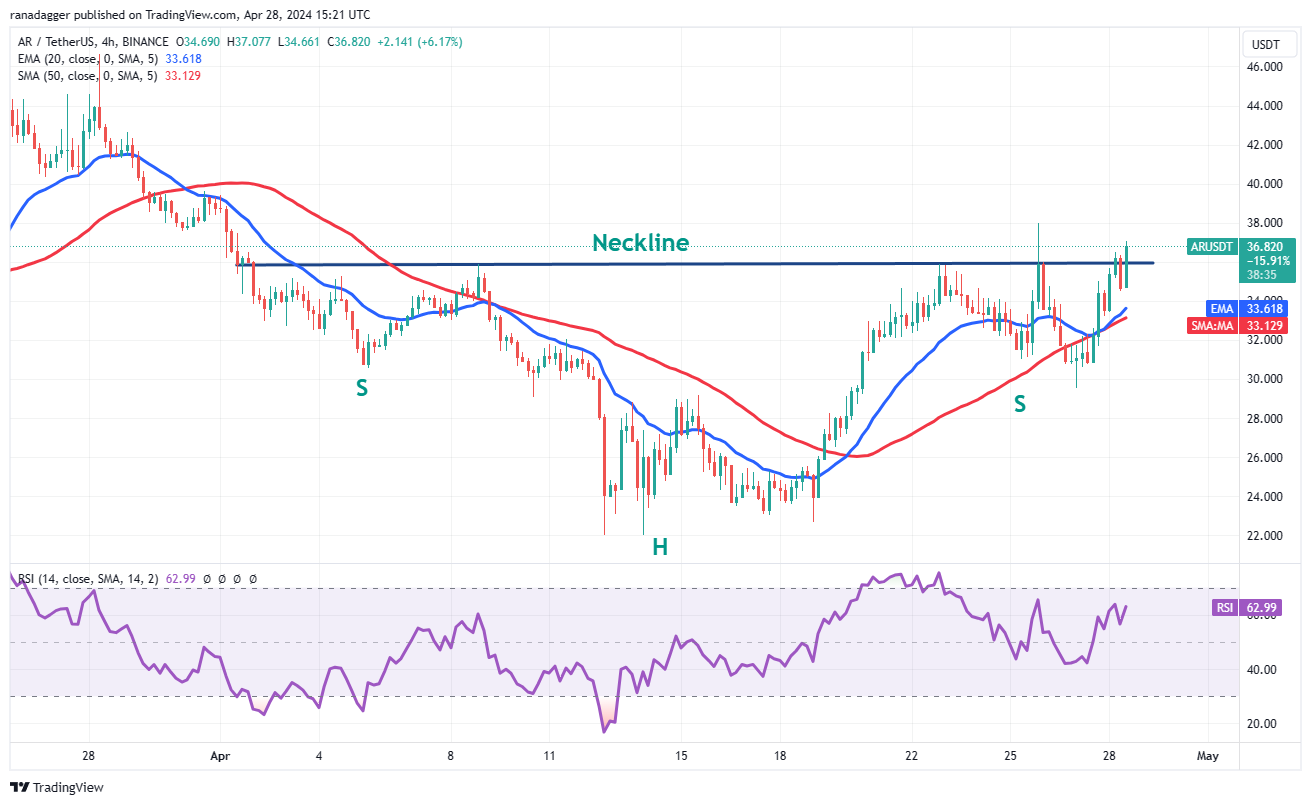
The pair shows the formation of an inverse head-and-shoulders pattern that will complete on a breakout and close above the neckline. If that happens, the pair is likely to dash toward the pattern target of $50.
On the contrary, if the price fails to maintain above the neckline, it will suggest that demand dries up at higher levels. The pair could then drop to the critical support at $30. A break below this level will tilt the advantage in favor of the bears.
Related: Crypto trader sees best ‘altseason’ since 2017 as Bitcoin price cools
Core price analysis
Core (CORE) has taken support at the 20-day EMA ($2.23) on two occasions in the past few days, indicating a positive sentiment.
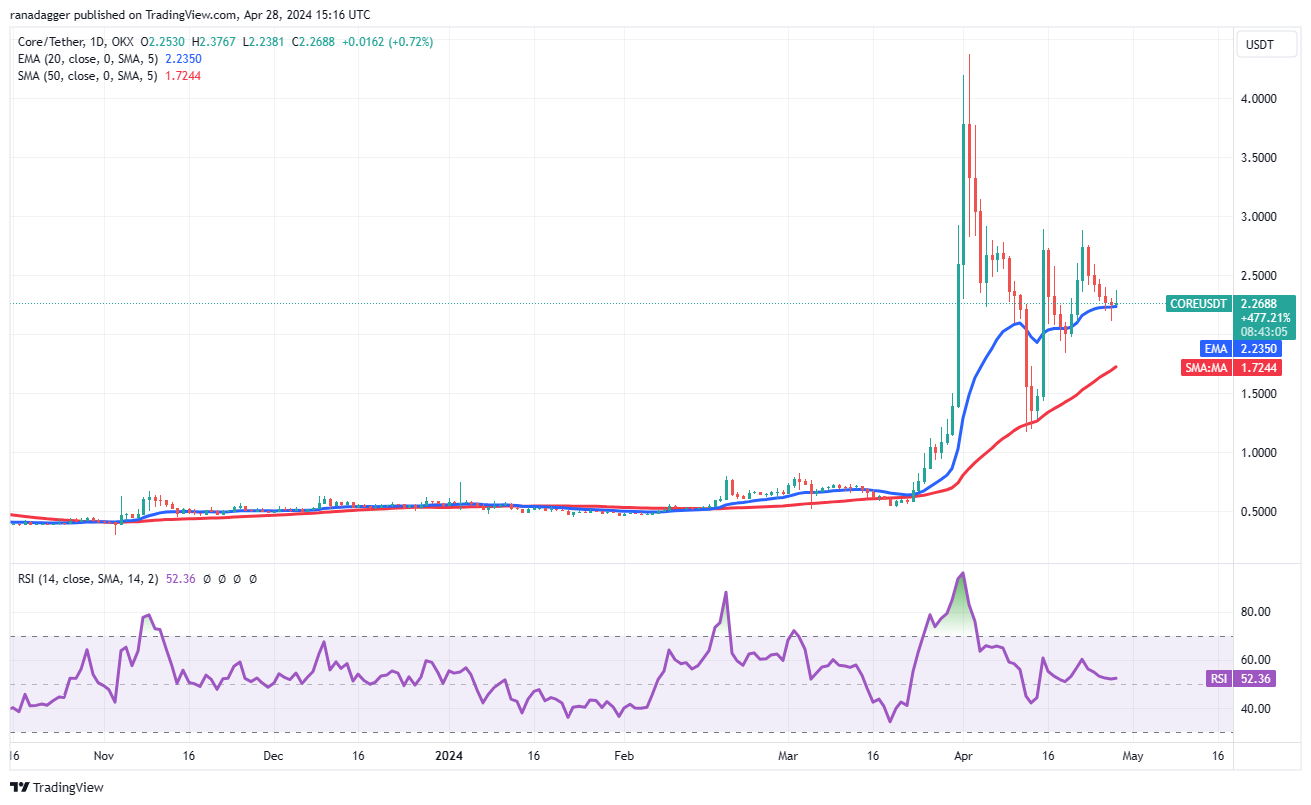
If the price bounces off the current level and breaks above $2.91, it will suggest that the bulls are back in the driver’s seat. The CORE/USDT pair could then pick up momentum and surge toward $4.
Contrary to this assumption, if the price turns down and breaks below the 20-day EMA, it will suggest that the bears are not willing to give up. That could open the doors for a drop to the 50-day SMA ($1.72).
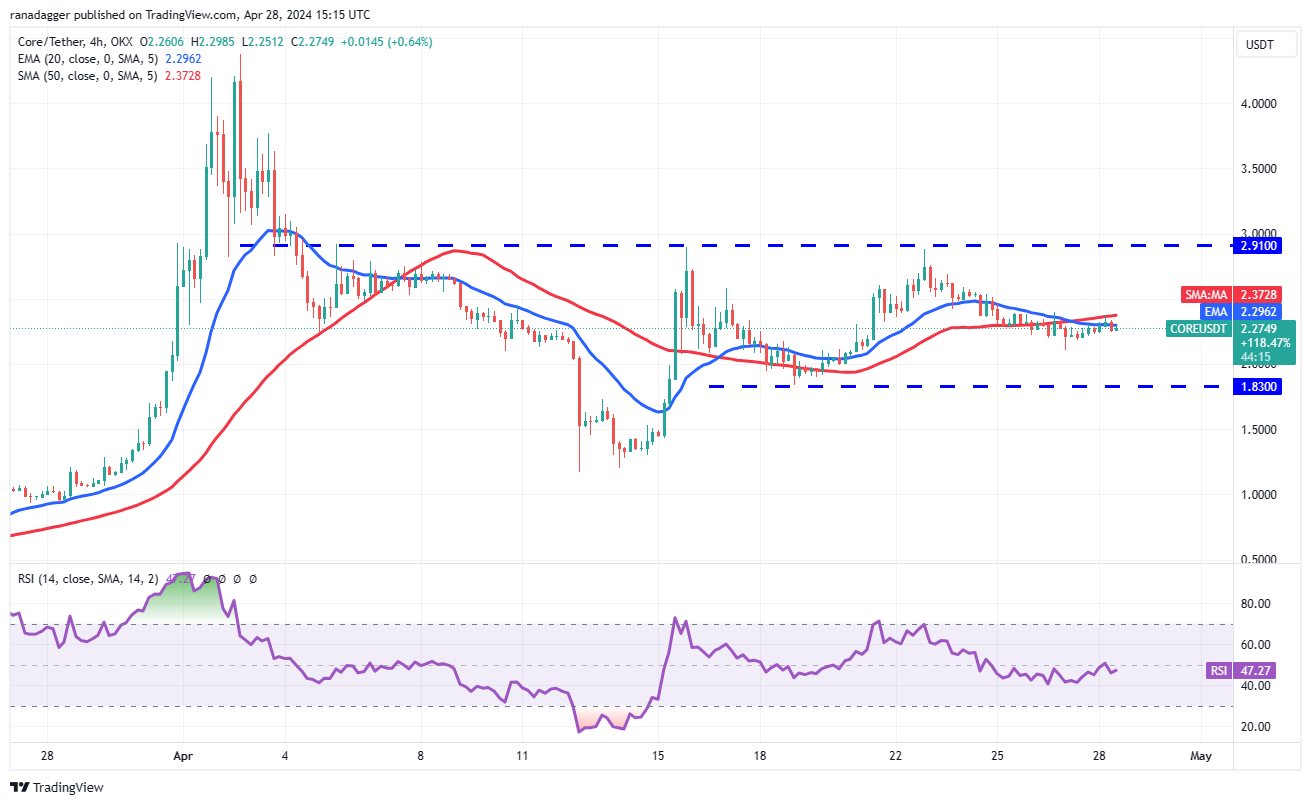
The 4-hour chart shows that the pair is range-bound between $1.83 and $2.91. The flattening moving averages and the RSI near the midpoint do not give a clear advantage either to the bulls or the bears.
If the price breaks above the moving averages, the bulls will try to push the pair to $2.91. The bears are expected to defend this level with vigor because a break above it may start a new up move.
Conversely, if the price turns down and breaks below $2.10, the pair may tumble to the strong support at $1.83.
Bonk price analysis
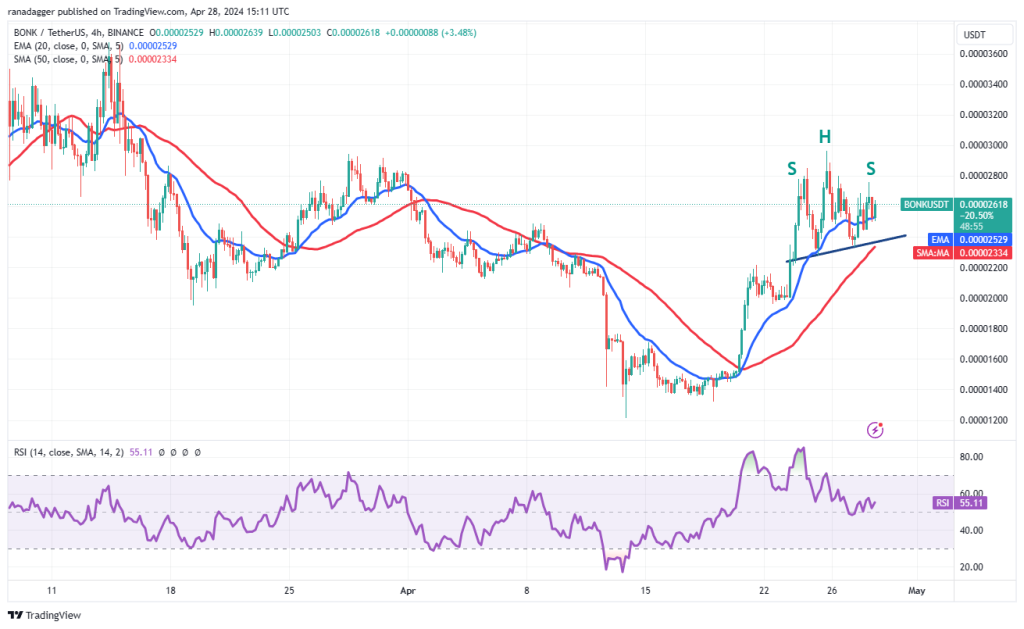
Bonk (BONK) climbed above the moving averages on April 23, signaling that the corrective phase may be ending.
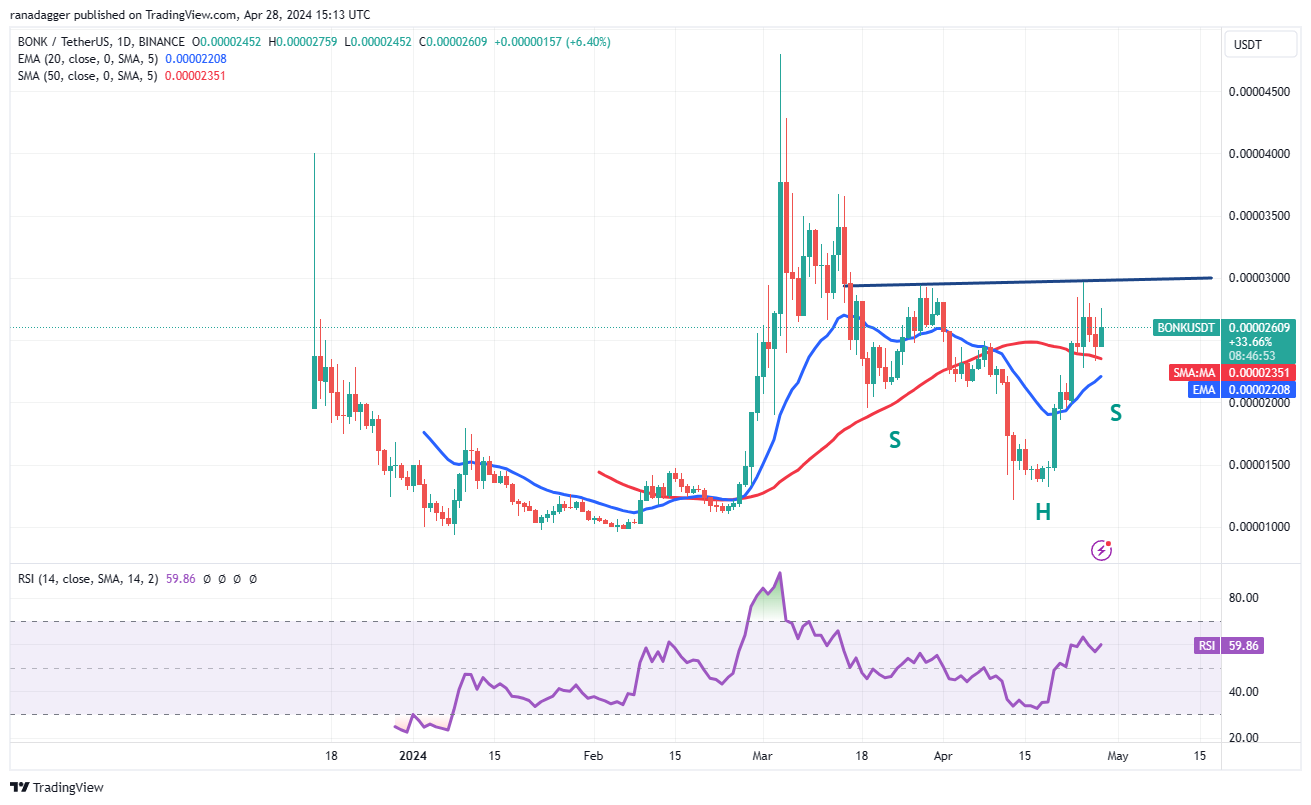
The bears tried to yank the price below the moving averages, but the bulls held their ground. This suggests that the bulls are trying to flip the moving averages into support. If the price bounces off the current level and breaks above $0.000030, the BONK/USDT pair will complete an inverse H&S pattern. This bullish setup has a pattern target of $0.000048.
However, the bears are likely to have other plans. They will try to sink the price below the moving averages and gain the upper hand. If they succeed, the pair may descend to $0.000019 and then to $0.000015.
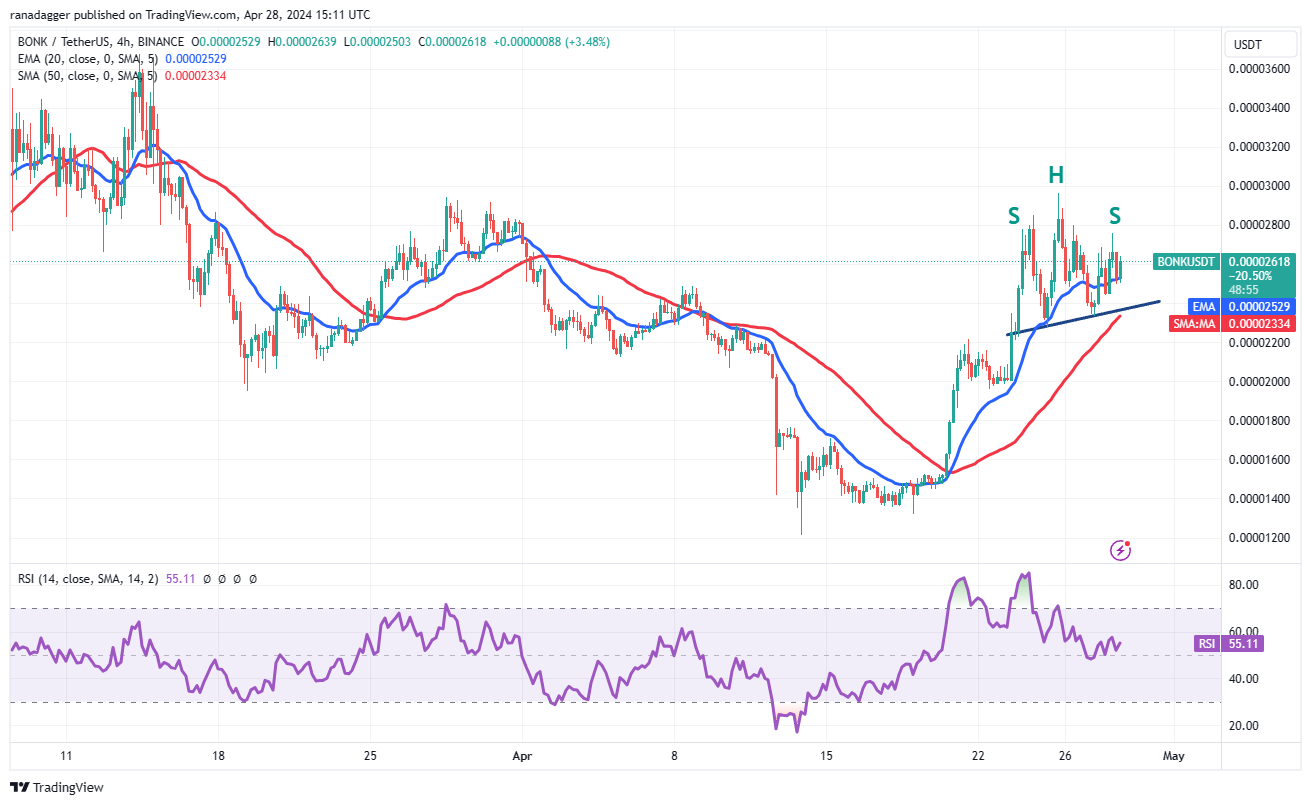
The 4-hour chart shows that the bulls are facing stiff resistance at $0.000030. The bears are trying to strengthen their position by pulling the price below the moving averages. If they manage to do that, the pair will complete a H&S pattern and drop toward $0.000019.
On the other hand, if the price turns up from the current level or the 50-day SMA, it will indicate that the bulls continue to buy on dips. A break and close above $0.000030 will be the first sign of strength. The pair may then jump to $0.000036.



Responses