LEARN RESISTANCE LEVEL IN 3 MINUTES – BLOCKCHAIN 101

Introduction
The concepts of support level and resistance level are some basic topics related to the technical analysis of financial markets. They are basically applicable to any financial market, whether it is stocks, foreign exchange, gold or cryptocurrency.
Support level and resistance level are very easy to understand. When the trend is at an insurmountable level, this level is an obstacle to some extent. The position of this obstacle is the support level or resistance level.
- Click to register SuperEx
- Click to download the SuperEx APP
- Click to enter SuperEx CMC
- Click to enter SuperEx DAO Academy — Space
This paper will explain in detail: the concept and usage of resistance potential
Resistance level, also known as pressure level, means that when the price rises to a certain price, the price stops rising or even falls back, and the resistance level plays a role in preventing the price from continuing to rise. Through technical analysis, we can predict the resistance level in advance. When the currency price runs to this position, we can lighten the position, and then take it back after the currency price drops, so as to complete the band operation and realize profit. Resistance potential andSupportThey are corresponding, and the resistance level and the support level are mutually transformed.
Generally, the currency price goes up, and the previous high point or gap or moving average is the pressure level. If the currency price may rise after the breakthrough, then the pressure level at this time will be transformed into the support level.
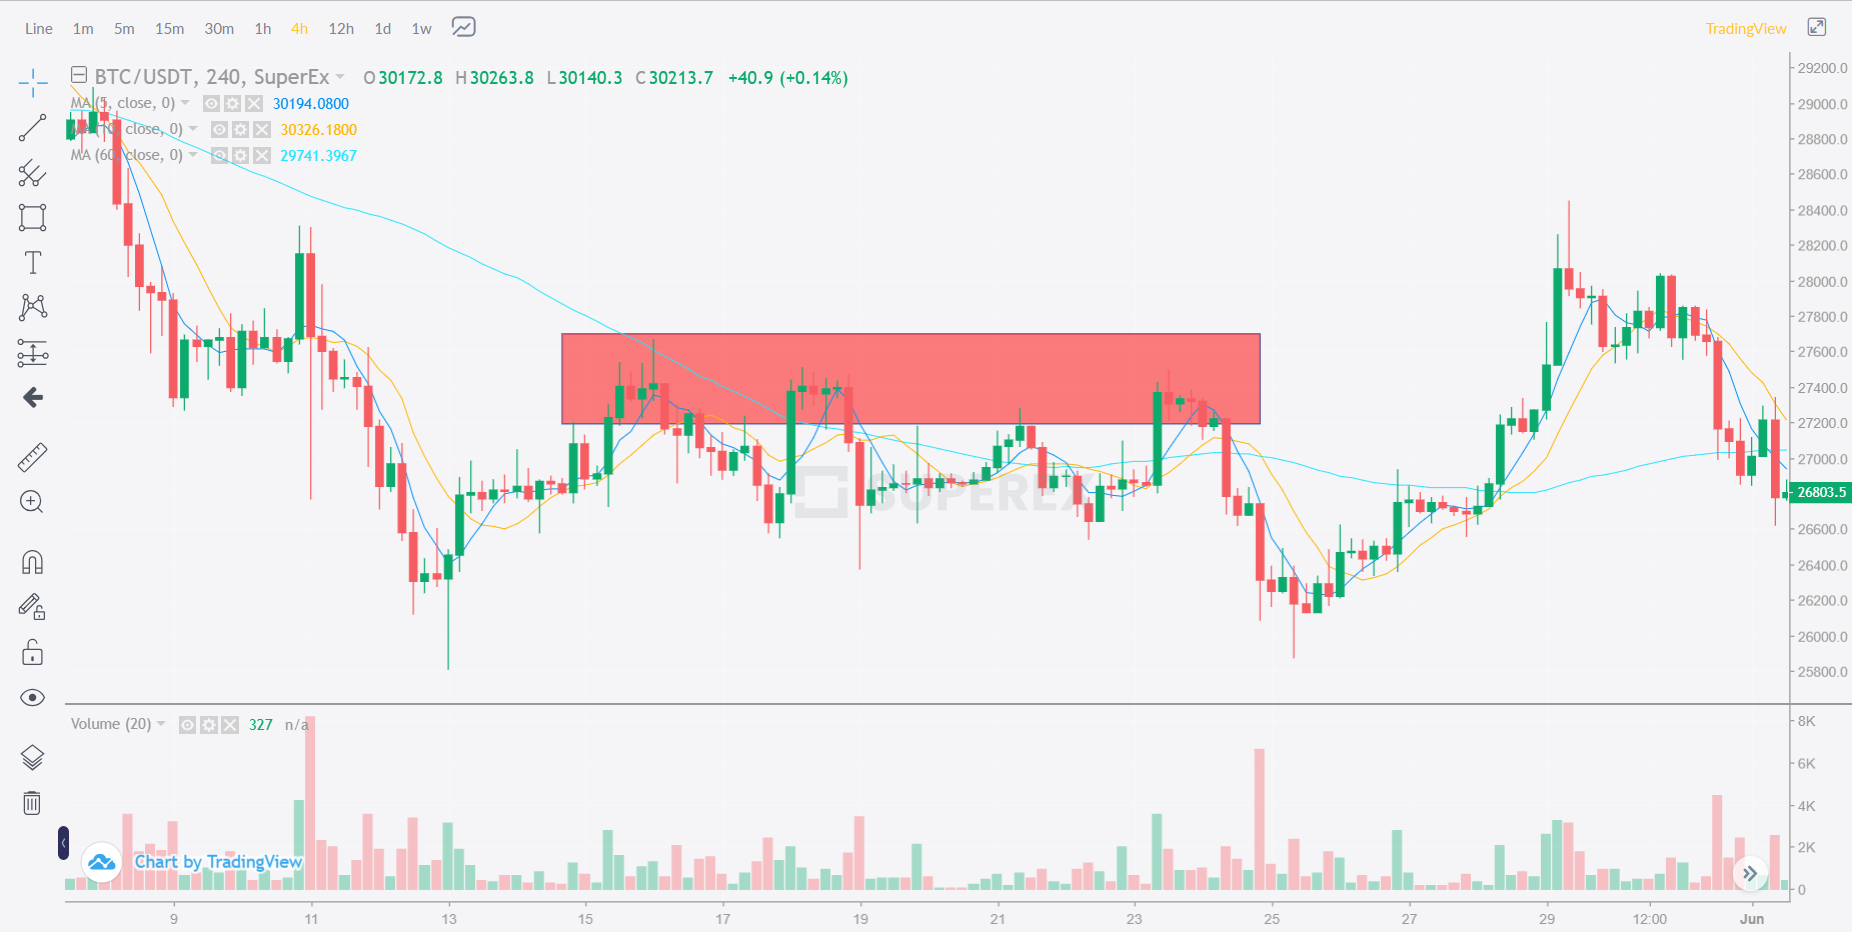
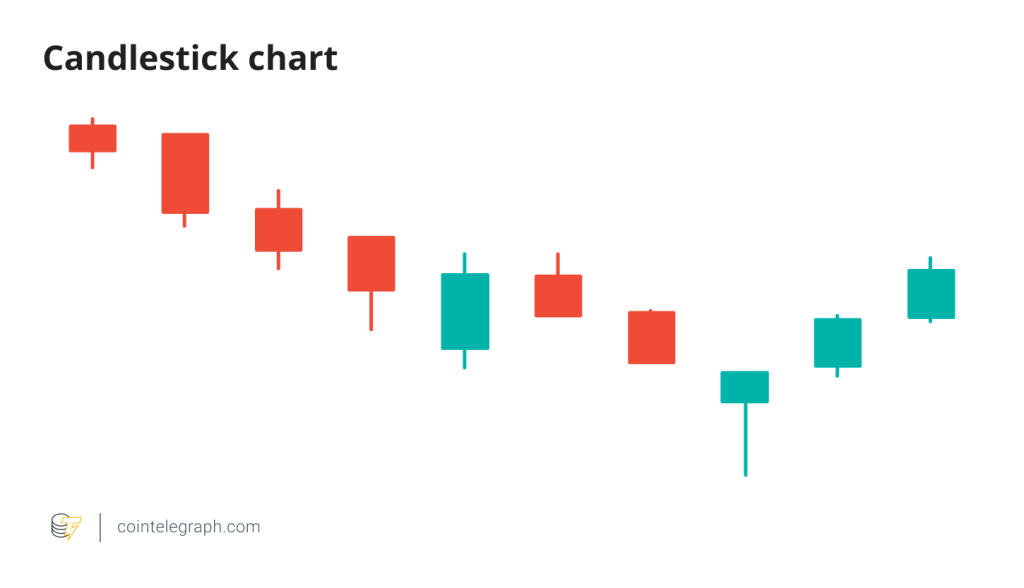
Let’s look at an example chart of resistance level. As we can see, the price shows a downward trend. However, after each rebound, it failed to break through the same area (red area) many times. This area is called pressure area or resistance area, and the high point in the area is resistance level.
How to find the resistance level
-
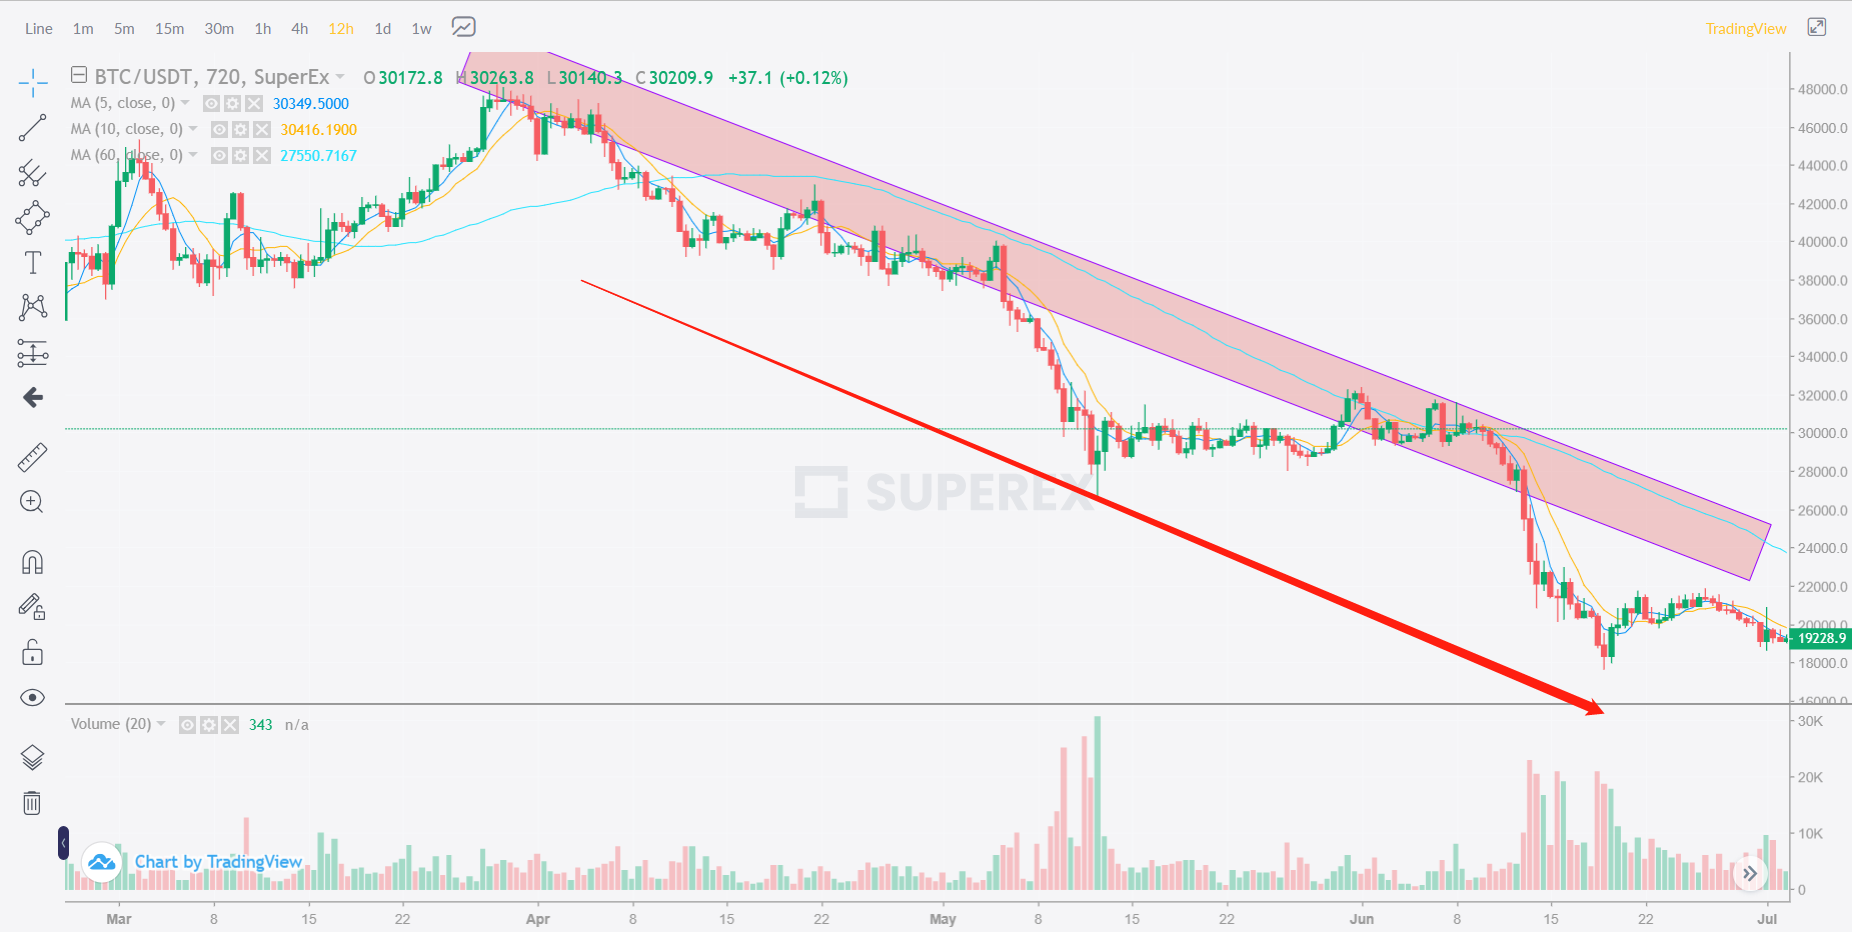
trendline
If the price has a series of rising lows and highs, there may be a downward trend, and in the downward trend, a resistance level may be formed above the trend line; The red area as shown below.
-
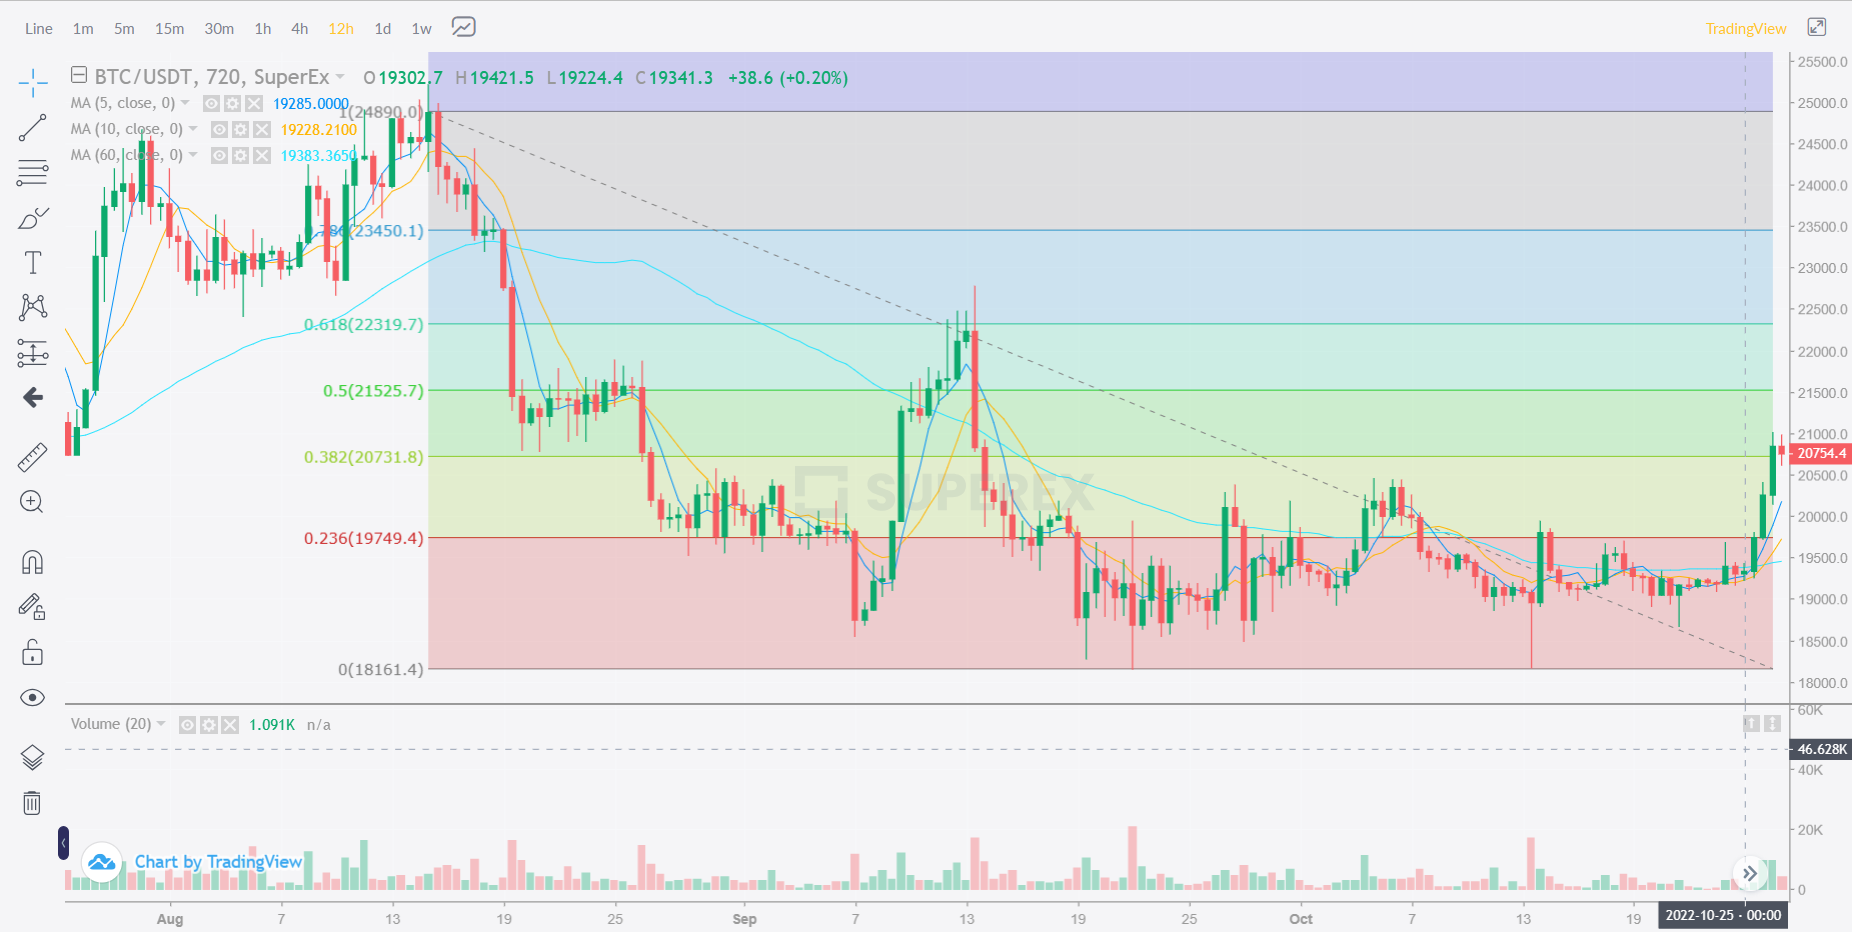
Fib Retracement Retreat Line
Fib Retracement retracement line is a set of horizontal lines drawn by using the golden ratio. When prices retreat near these horizontal lines, they may form resistance levels. You can first select a high point as the base point and connect the relative low points in a period of time to draw a set of golden section lines, and the corresponding point of each line can be judged as the resistance level. The intersection of the dividing line corresponding to 23.6 and 38.2 in the following figure and the subsequent K-line diagram may become the resistance level.
-
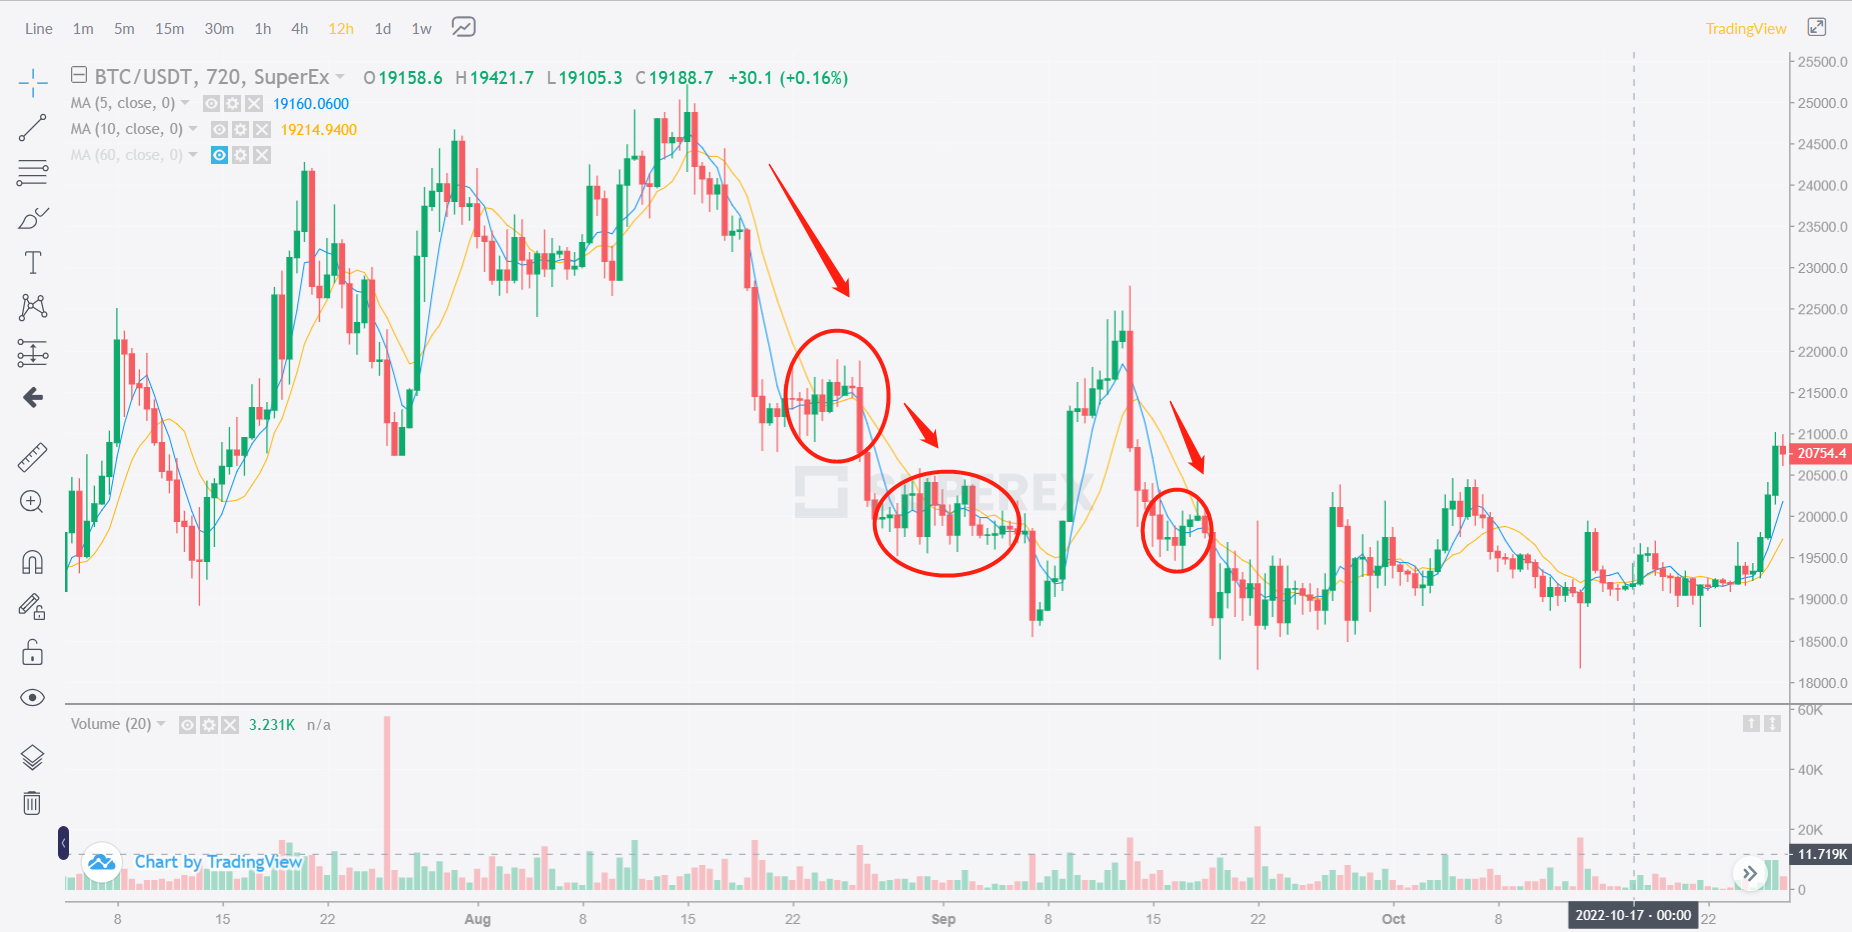
MA
By calculating the average price to smooth the price trend, the moving average can be used to judge the resistance level. In the downward trend, the intersection of the moving average and the K line may form the resistance level. As we can see from the figure below, in the downward trend, every reversal of the trend is stopped at the intersection of MA and K-line.
How do traders use resistance?
Both the resistance level and the support level mentioned in the previous section are designed to help technical analysts find the point where the trend is likely to reverse or pause in the price trend.
Usually, once the price reaches the resistance area, two things may happen: the price will either reverse from this area, or break through and continue in the trend direction-until it reaches the next resistance area.
Selective selling near the resistance level is a favorable trading strategy. When the price rises to the resistance level, it is likely that the price will fall back. At this time, you can consider selling. However, it should also be noted that the resistance level is not absolute, and the price may break through the resistance level. At this time, stop loss should be made in time.
Summary
Support level and resistance level are not absolute, and their effects on prices are temporary and may change with market conditions. If it falls below the support level, it may become resistance, and after the resistance level is broken, it will also become support level. Therefore, when judging the support level and resistance level, it is necessary to comprehensively analyze other technical indicators and market trends to increase the accuracy of judgment.


Responses