LEARN TREND LINES SUPPORT IN 3 MINUTES – BLOCKCHAIN 101
Introduction
The concepts of support and resistance levels are some of the most basic topics related to technical analysis in financial markets. They apply to virtually any financial market, be it stocks, foreign exchange, gold, or cryptocurrencies.
Support and resistance levels are very easy to understand – they are essentially levels at which a trend cannot break through, acting as barriers of sorts. The location of these barriers is referred to as support or resistance levels.
In this article, we will delve into the concept and application of support levels.
Concept of Support Levels
A support level refers to a price point at which a price rebound or trend reversal occurs as it falls. It is a price at which buyers find value and ultimately prevent the price from dropping below its previous low. A support line is formed when the price stops falling, and may even rise again, as buyers step in around a certain price level.
The point at which the price fall is halted, is the support level, where the support line is drawn.
Support levels are regarded as good entry points in anticipation of a market rally. Therefore, identifying support levels is essential knowledge for those who wish to participate in market trading.
Let’s take an example of a support level. We notice that prices continually enter an area where the asset is being purchased. When this area is repeatedly tested, a support range is formed. As bears (sellers) are unable to push the price further down, a rebound in price occurs – possibly commencing a new uptrend.
4 Types of Support Levels
- Dense Transaction Area Support.This can manifest as continuous high trading volume, or as a long period of sideways trends. It is a zone rather than a fixed price point.
- Long-term Moving Average (Average Cost) Support Zone.Overall, selling below the long-term moving average is seen as closing positions. However, to make investors who absorbed at the bottom close their positions is not easy, unless there are significant factors.
- Support Lines from Various Technical Patterns Familiar to Investors. Things recognized by the public naturally have an effect.
- Support Derived from Pure Mathematical Calculations: such as the 0.618 golden ratio level.
The underlying meanings of these four types of support are slightly different. The first two types, which are fundamentally based on trading volume, are primary. If one or more other types of support coincide, it’s even more reliable.
Examples of Typical Support Levels
Previous Support Level
Moving Average Support
How to Find Support Levels
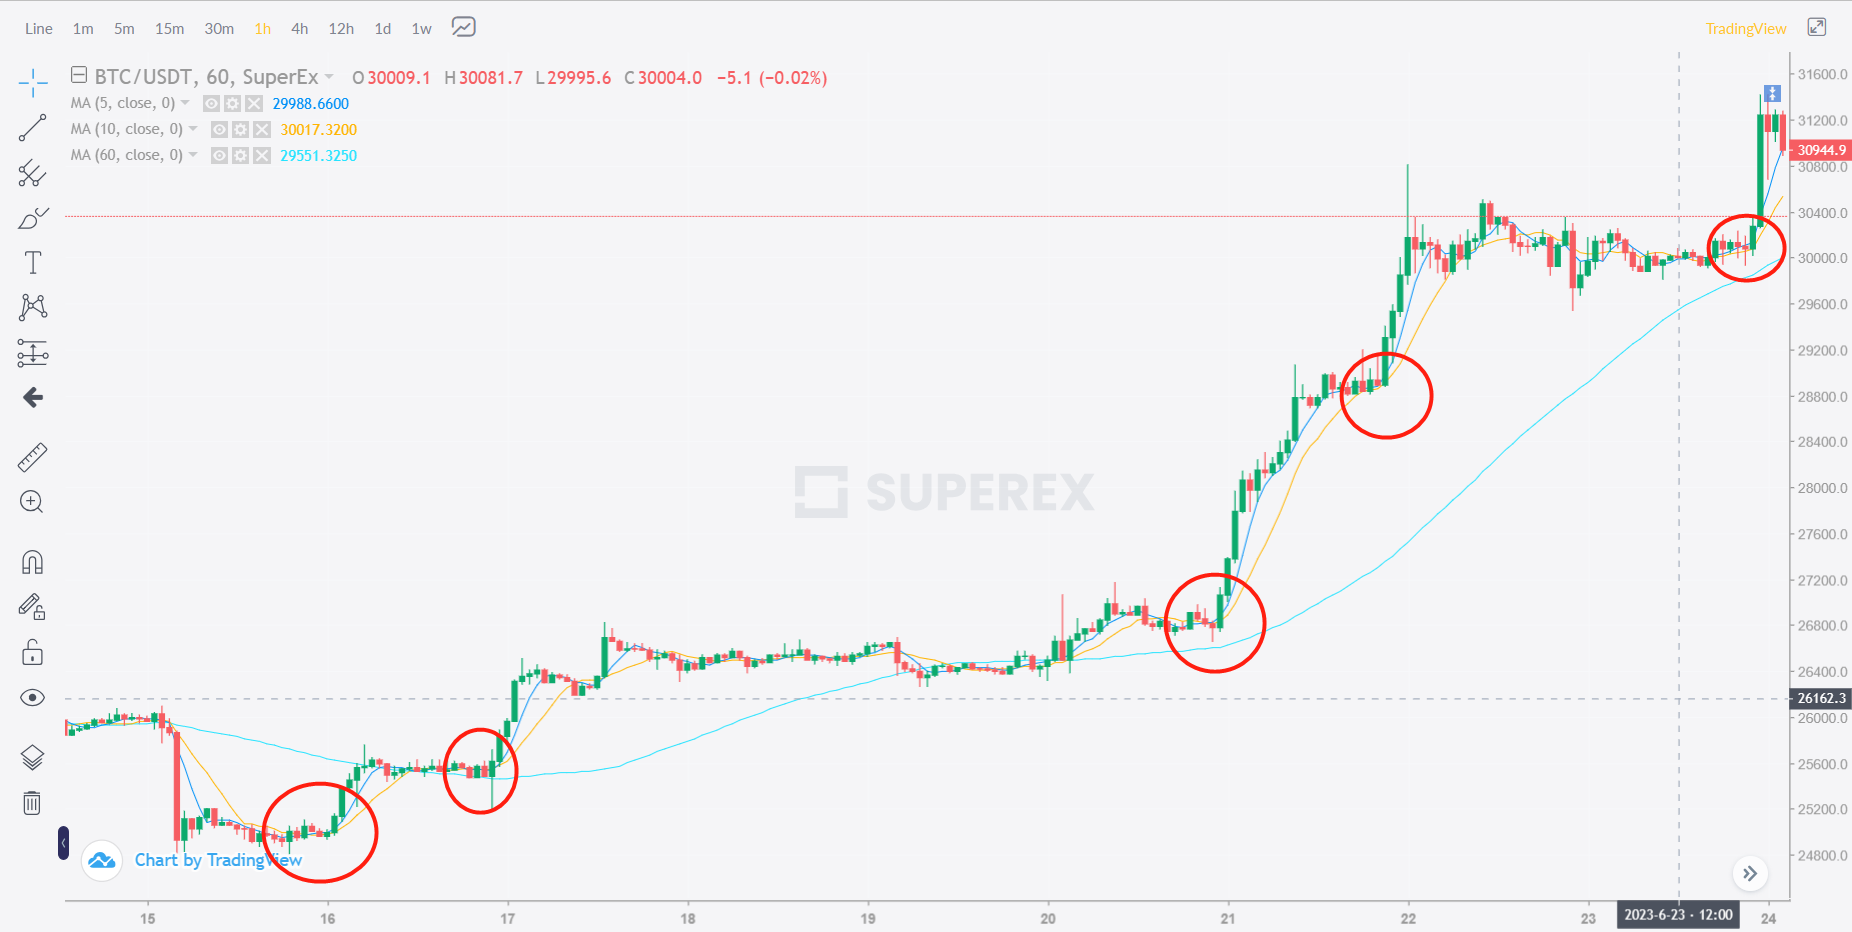
Using Moving Averages to Find Support Levels
A moving average system can be used to identify support pressure, with the 05, 10, 20, 60, and 120-day moving averages being the most important. For example, in the case of moving average support shown above, when the moving average is reached, it forms support pressure. From 5 days to 120 days, the longer the moving average, the greater the support pressure.
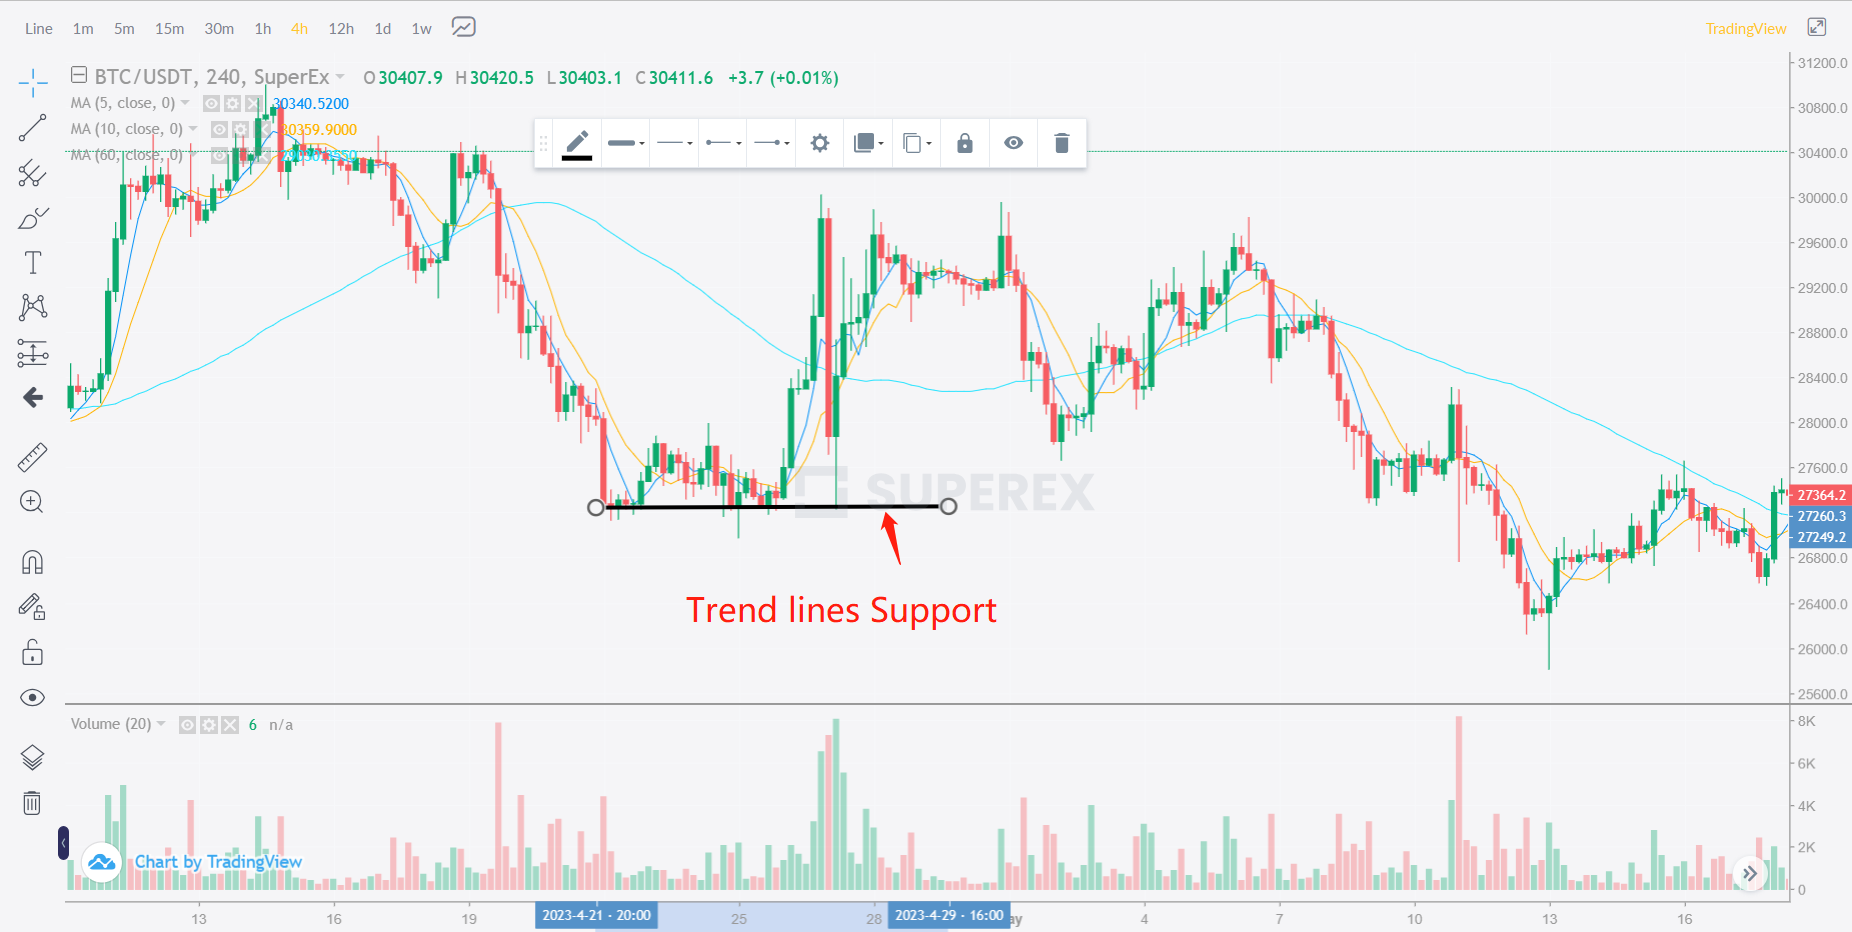
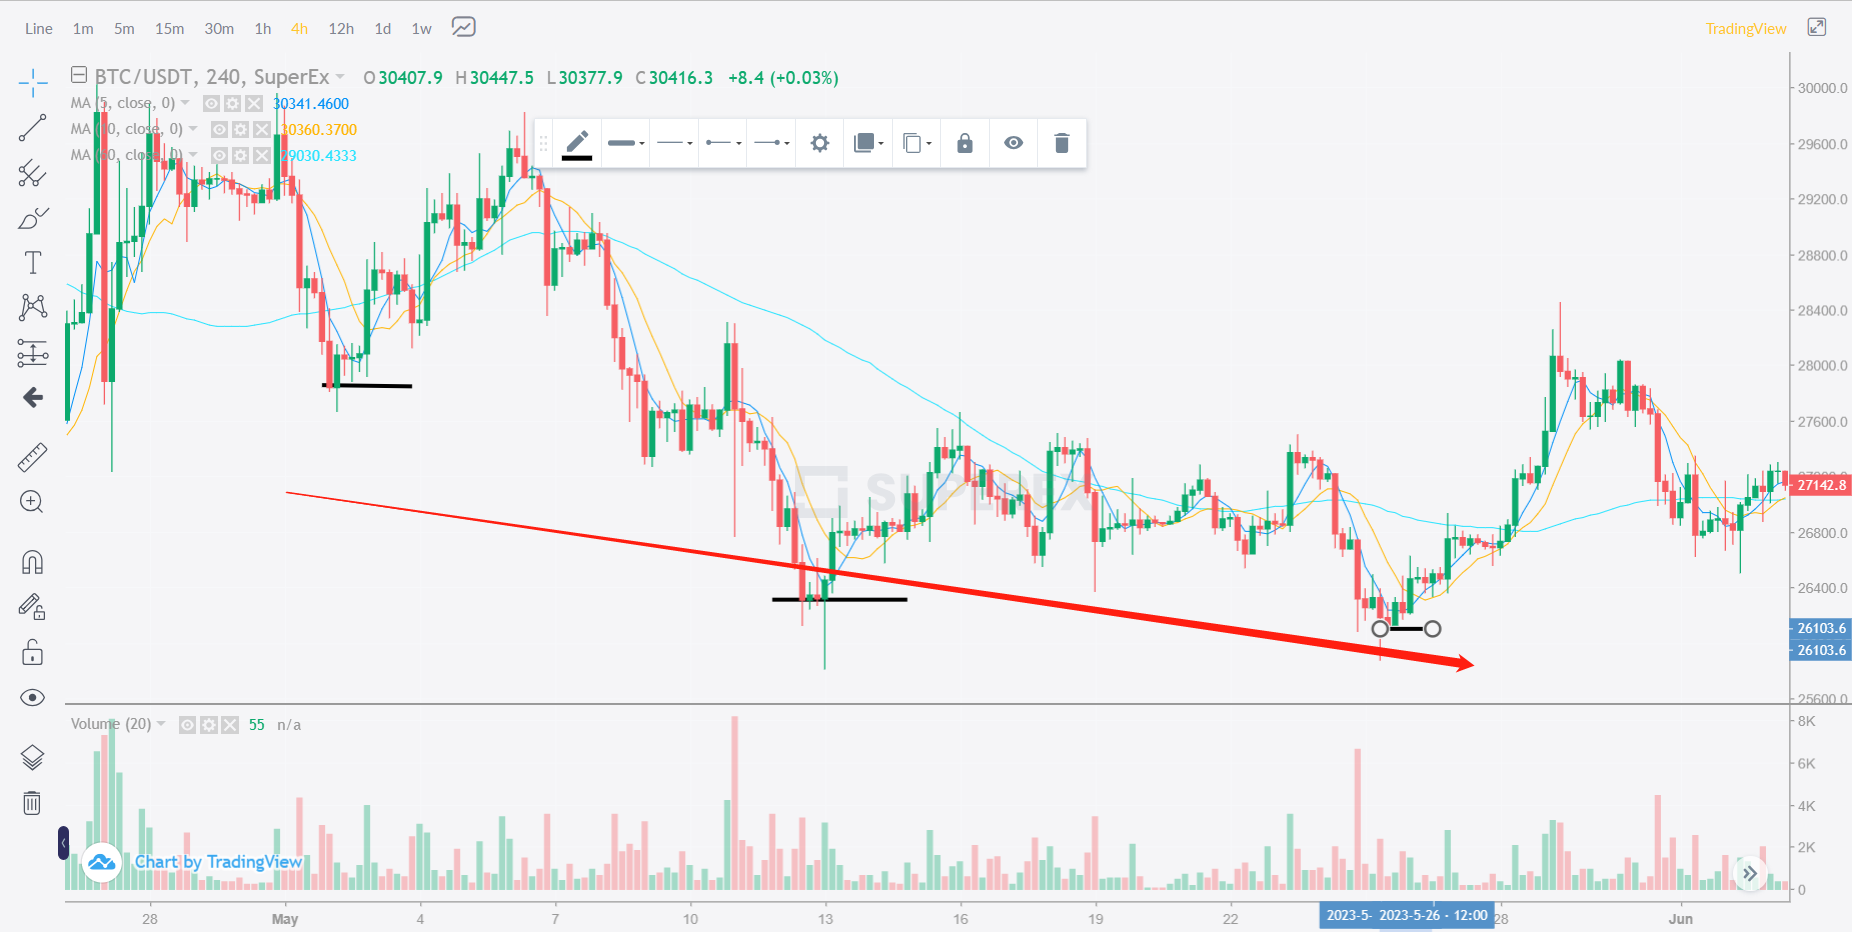
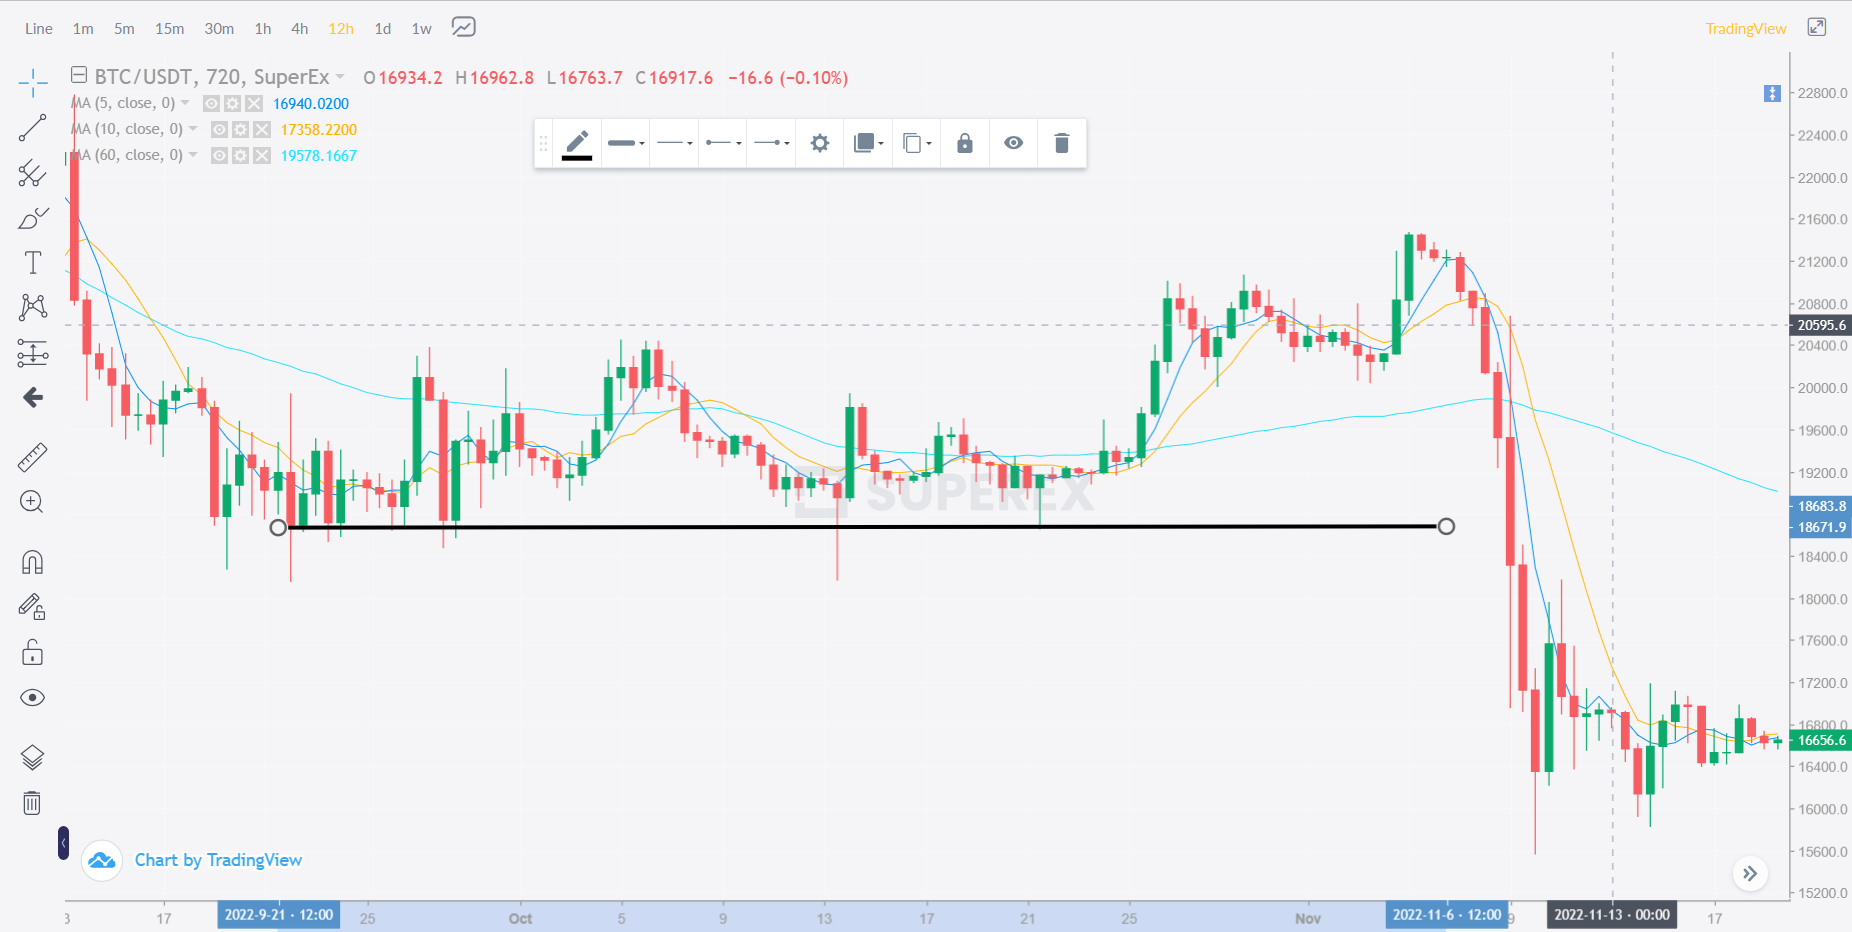
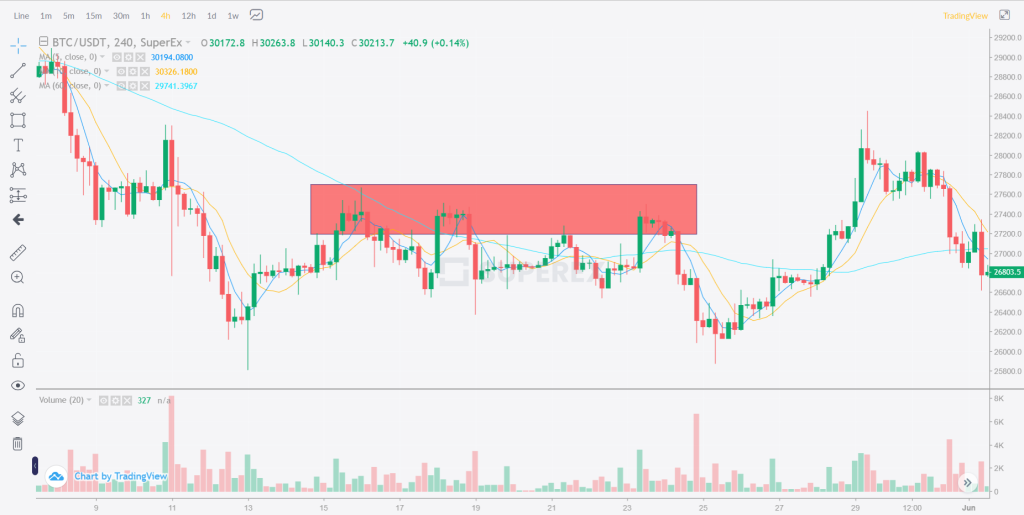
Using Horizontal Lines to View Support Pressure
Horizontal lines drawn based on a certain high or low point serve as support pressure. Simply put, draw a horizontal line based on the previous low point to explore new support points. For example, in the figure below, the subsequent support points are all at the horizontal line drawn based on the previous low point. Of course, the price in the figure has rebounded before it actually reaches the real support point.
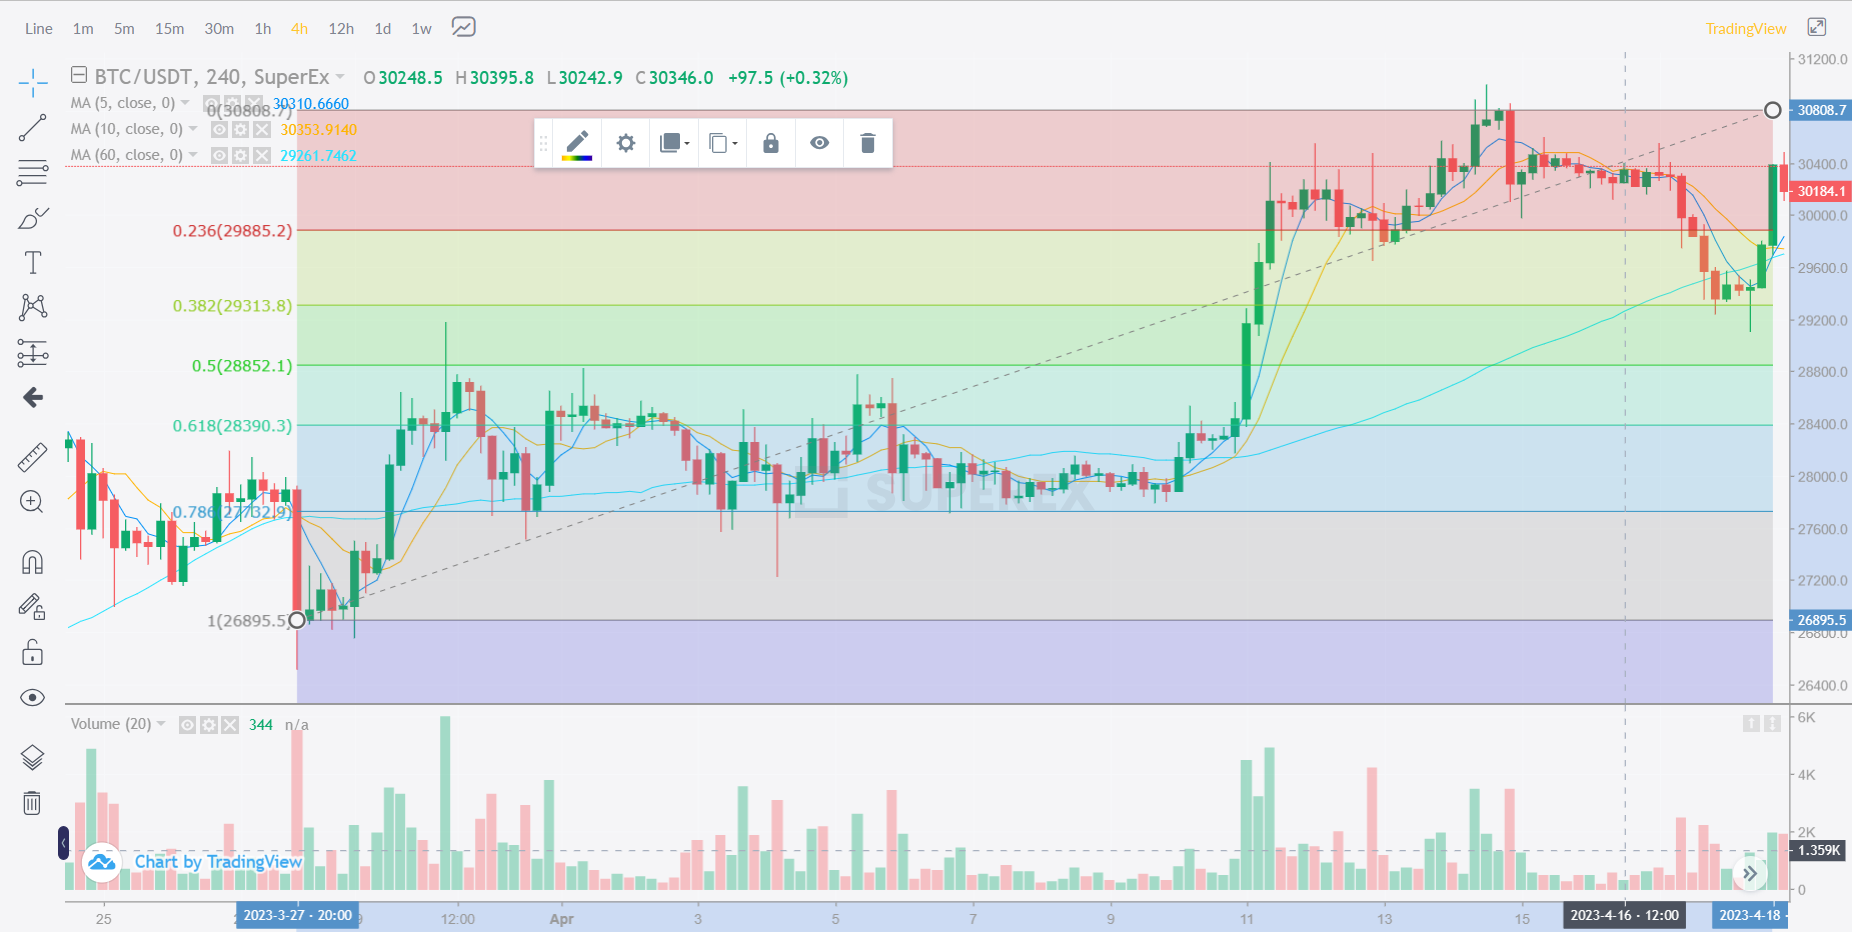
Finding Support Levels Using Fibonacci Retracement Tool
The Fibonacci retracement tool is one of the most common and popular trend analysis tools in the trading market, and the levels it describes can also serve as support levels. For instance, in the chart below, the 78.6% Fibonacci level acts as a support level multiple times, and in the subsequent trend, the 78.6% line still provides support.
Support from News and Fundamentals
Support can also come from directional issuance, the average price of institutional holdings, capital entry, and valuation, which is calculated by various methods and models based on industry price-earnings ratio, earnings, and net assets.
On the one hand, this support comes from market speculation — speculating that capital and directional issuers will save themselves in order to preserve capital and make a profit;
On the other hand, some funds indeed make self-rescue efforts — for example, large investors may resist desperately near their collateral warning lines to prevent the price or collateral from collapsing.
Summary
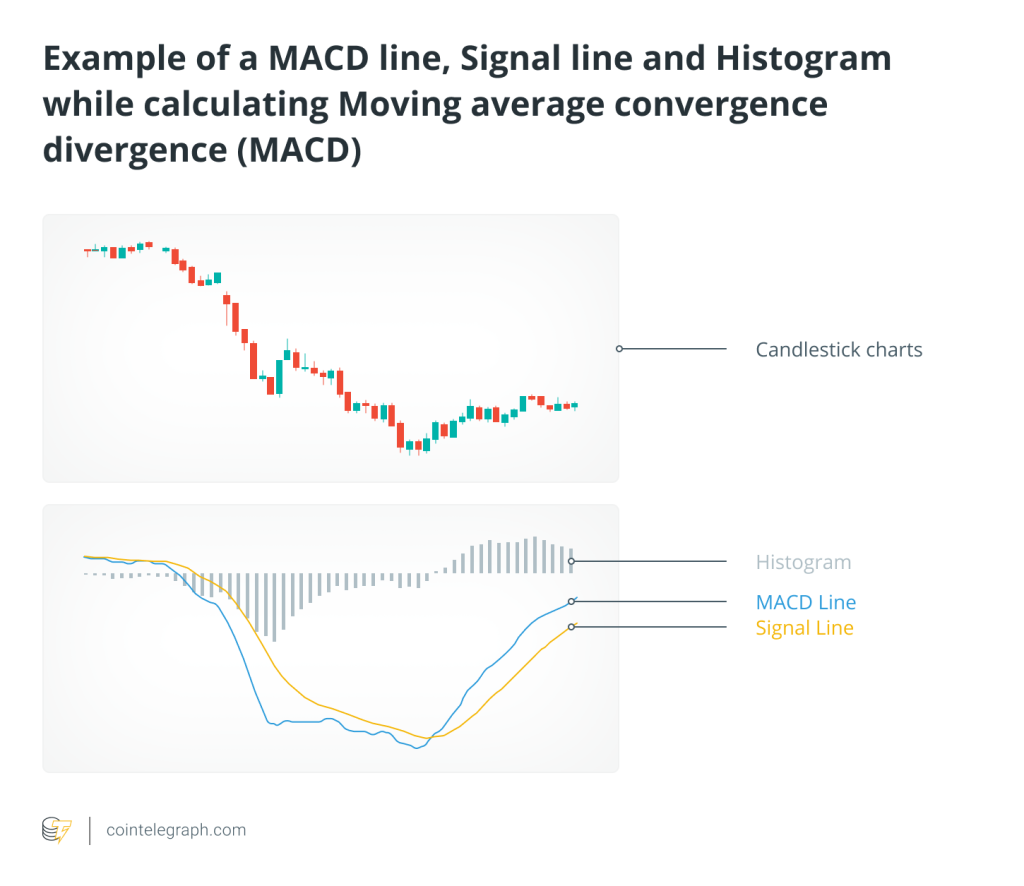
Once again, it’s crucial to emphasize that market analysis should adopt a principle of technical convergence, which means combining multiple strategies into one. For instance, consider combining trading volume, MACD, KDJ, moving averages, and support levels. If these five indicators, or more, suggest a trend reversal, the more comprehensive the integration, the more accurate the prediction of future trends will be.


Responses