LEARN LINEAR REGRESSION CURVE IN 3 MINUTES – BLOCKCHAIN 101
IN-3-MINUTES@2x-1-1024x576.png)
Guide:
In market analysis trading, statistical methods and charts are more commonly used to analyze stock price movements, price trends, and market volatility.
“Linear Regression Curve” is not a standard statistical term or indicator. Typically, linear regression is a statistical method for modeling and analyzing the linear relationship between continuous data. Linear regression involves fitting a straight line or hyperplane to represent the linear relationship between the dependent variable and the independent variables, usually used for continuous data and regression analysis, especially in short-term and medium-term trading analysis, where it is very effective.
Introduction to Linear Regression Curve
The development of linear regression analysis as a statistical method has a long history. It can be traced back to the late 19th and early 20th centuries when mathematicians and statisticians began to study how to fit data and establish mathematical models to explain phenomena.
Famous mathematicians and scientists Carl Friedrich Gauss and Adolph Quetelet pioneered the concept of the least squares method, which laid the foundation for linear regression analysis later on.
In the 20th century, with the development of computers and statistics, linear regression analysis became one of the common analysis methods in the fields of statistics and economics. It is widely used to establish mathematical models, predict trends, and explain relationships between variables.
Over time, the application fields of linear regression analysis have continuously expanded, including economics, social sciences, natural sciences, and engineering. In the financial and investment fields, linear regression analysis is also widely used for the prediction and analysis of financial market trends.
In the cryptocurrency and financial technology fields, linear regression analysis, as a fundamental data modeling and forecasting method, helps analyze the trends and volatility of cryptocurrency prices. With the advancement of technology, more advanced analysis methods are applied to the cryptocurrency market to help investors and traders make more informed decisions.
The Role of Linear Regression Curve in the Trading Market
In the cryptocurrency trading market, the Linear Regression Curve can be used to analyze price data and market trends, serving the following differentiated roles:
Trend analysis and identification: By plotting a linear regression curve, traders can identify the trend of cryptocurrency prices. This helps to determine the current main trend of the market, such as an uptrend, downtrend, or sideways trend. Based on different types of trends, traders can develop corresponding trading strategies to achieve differentiation in the market.
Price prediction: The linear regression curve can be used to attempt to predict future price trends. Although linear regression is usually not suitable for predicting extreme price fluctuations, it can provide some guidance for short-term and medium-term price movements. Traders can use these forecasts to develop differentiated trading plans to obtain a better risk-reward ratio.
Support and resistance levels: The linear regression curve can help identify price support and resistance levels. These levels are points where the price may encounter significant resistance or support. Traders can base their buying or selling decisions on these levels to achieve differentiation from other traders in the market.
Volatility analysis: The slope and standard deviation of the linear regression curve can be used to measure the degree of price volatility. Larger slopes and standard deviations usually indicate greater price volatility. Traders can use these volatility indicators to choose different trading strategies to adapt to the market’s differentiated volatility.
Risk management: Analysis of the linear regression curve can help traders better understand market risks and volatility. Through differentiated risk management methods, traders can reduce potential losses and improve trading efficiency.
Practical Demonstration of the Linear Regression Curve in the SuperEx Market
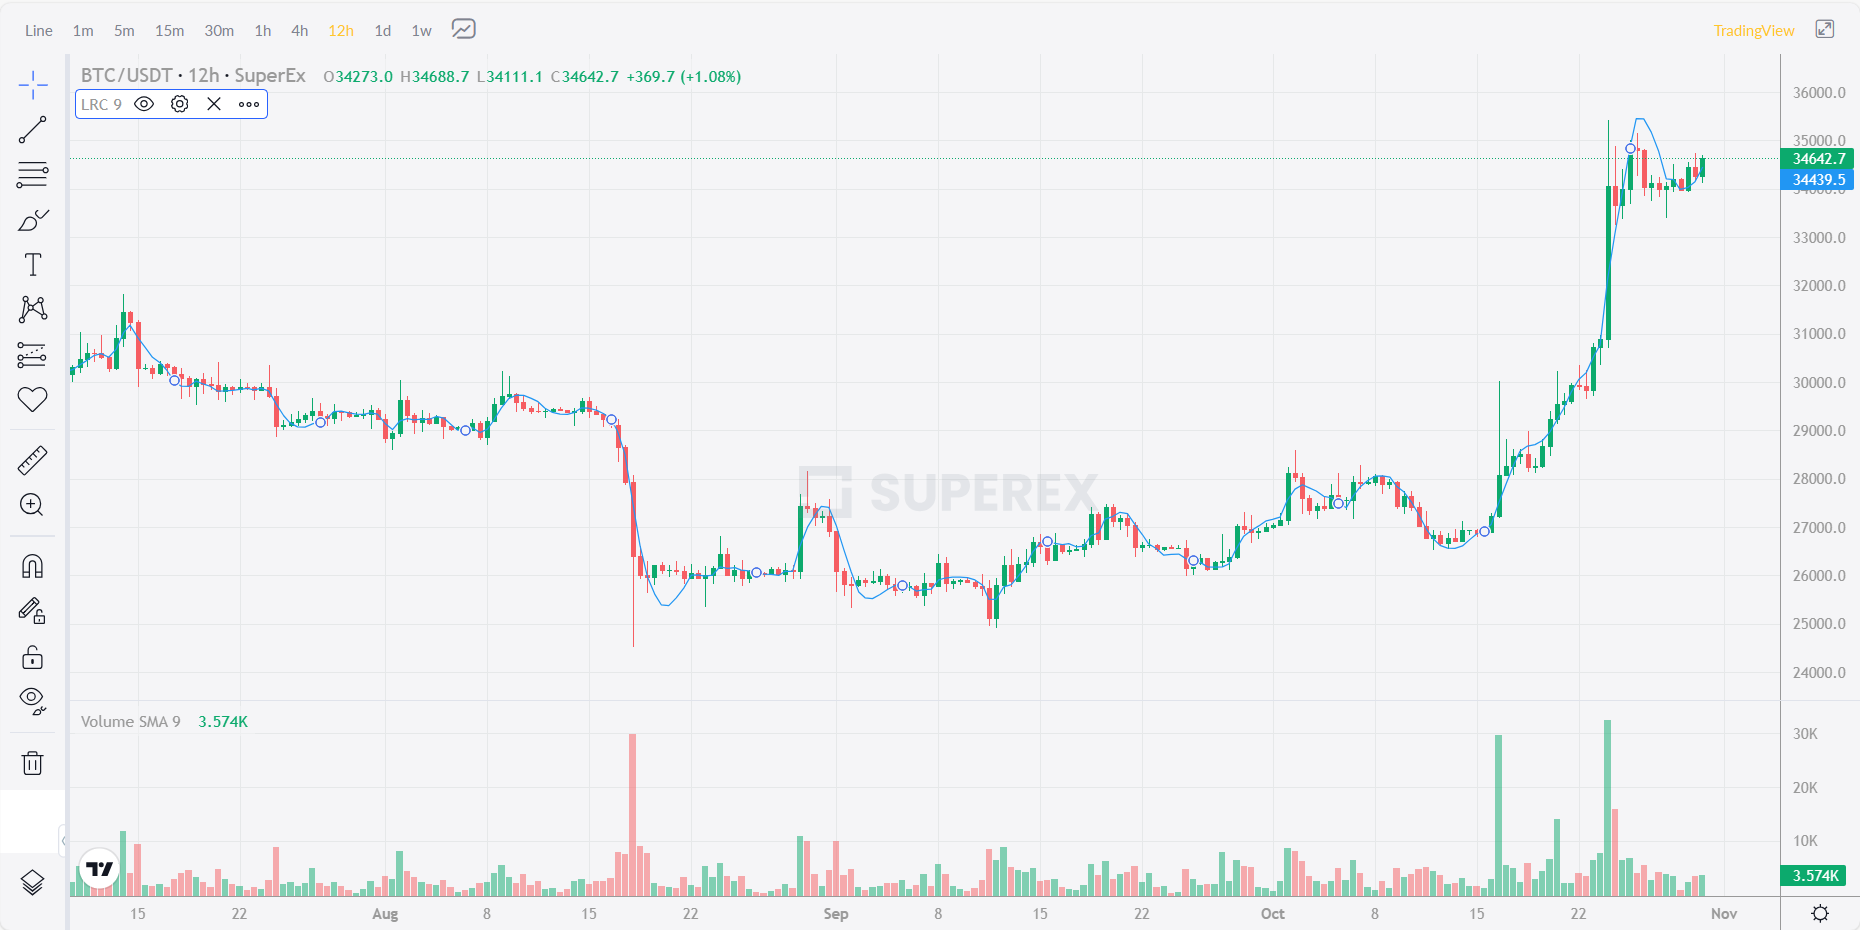
Currently, SuperEx has drawn a complete LRC curve for users, which can be called up in the market. Below we will use actual cases to demonstrate how to use it:
Trend analysis: In the following figure, the blue line is the LRC curve. We can see that the LRC curve overlaps with the price trend by more than 95%, which clearly has predictive value.
Observe the slope and direction of the linear regression curve. A positive slope may indicate an upward trend, a negative slope may indicate a downward trend, and a horizontal slope may indicate a sideways trend.
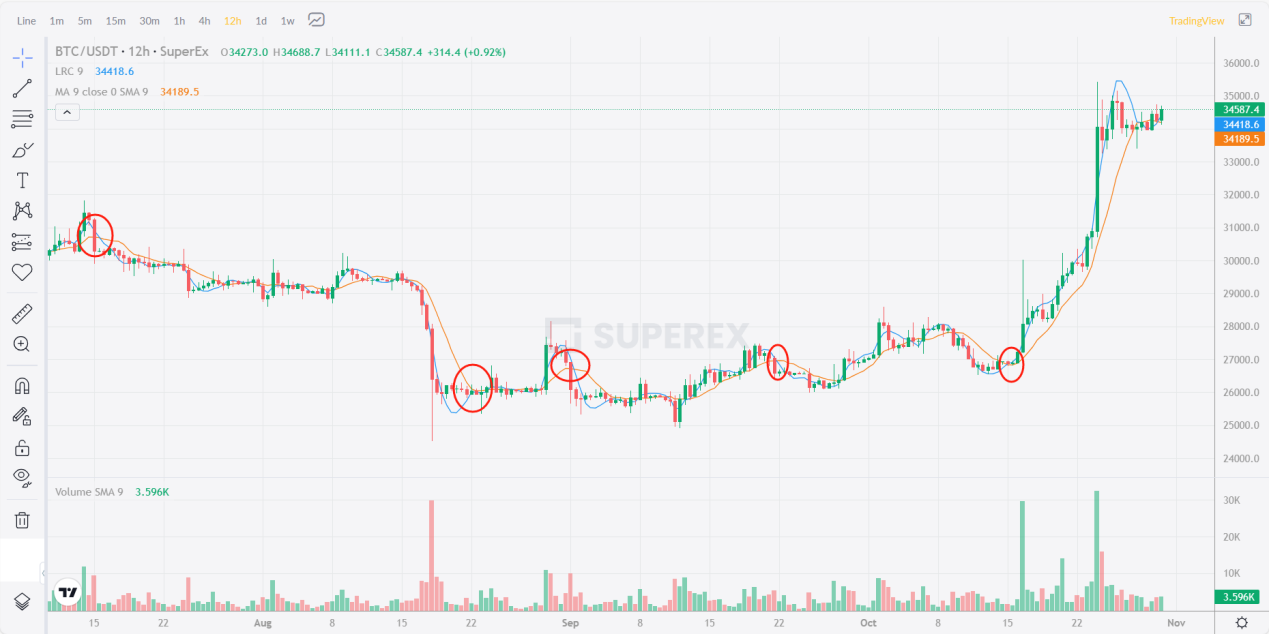
Support and resistance levels: Determine support and resistance levels by observing the intersection points of the linear regression curve with the MA curve. These levels may become buying or selling points, as the price may reverse near these levels.
As shown in the figure below, we set a 5-day MA curve. It can be seen that the intersection points of the LRC and MA are basically the turning points of the trend.
Volatility analysis: Observe the standard deviation of the linear regression curve to understand the degree of price volatility. A larger standard deviation indicates greater volatility, while a smaller standard deviation indicates less volatility.
In summary, the linear regression curve plays a differentiated role in the cryptocurrency trading market, helping traders identify trends, develop trading strategies, manage risks, and make predictions. However, it should be noted that the linear regression curve is usually a simple tool, and the cryptocurrency market is very complex, so differentiated analysis usually needs to be combined with other technical indicators and analysis methods to more comprehensively understand the market.


Responses