LEARN AROON IN 3 MINUTES – BLOCKCHAIN 101

Introduction
The Aroon indicator is primarily used for predicting the trends and directions of the stock market, aiding investors in identifying trends and reversals. In other words, the Aroon indicator has a certain predictive capability for market trading.
Overall, the effectiveness of the Aroon indicator in predicting long-term investments over a year is greater than its effectiveness in forecasting short-term investments over a month. Moreover, its application in the trading markets of internet and fintech companies (such as financial, digital technology stocks, or cryptocurrency markets) is significantly more effective than in traditional financial markets.

Introduction to the Aroon Indicator
In technical analysis, Aroon is a unique technical indicator. The term “Aroon” comes from Sanskrit, meaning “dawn’s early light”. It is not as widely known as MA, MACD, or KDJ, having been introduced later, only in 1995 by Tushar Chande, who also invented the Chande Momentum Oscillator (CMO) and the Intraday Momentum Index (IMI).
Initially, the Aroon indicator was used to determine the fluctuating trends of commodity futures market prices and estimate the strength of these trends. Later, it was applied to stock market trend analysis. By calculating the number of periods since the price reached its recent highest and lowest values, it helps investors find trends and reversals, and make predictions about future market movements, generating trading signals.
Effectiveness of the Aroon Indicator Confirmed
Global research on market prediction mainly focuses on how to build strategy models based on the original definition for price prediction, and on discussing the effectiveness of mathematical models. Scholars have theoretically introduced the Aroon indicator system and analyzed its feasibility in price prediction using short-term data from the Indian stock market.
Zarikas, Christopoulos, and Rendoumis studied the daily closing prices of the Athens stock index from August 25, 2005, to August 3, 2007, using the Aroon indicator to determine trends and constructing a thermodynamic model to explain the time trend characteristics of the stock market index from a macro perspective.
The study found that as the number of backtesting samples increased, the precision of the thermodynamic model, centered on the Aroon indicator, in predicting index trends also increased. Additionally, Silva, Castilho, and Pereira loaded the Aroon indicator, moving average indicator, Chande Momentum Oscillator, Commodity Channel Index, and other indicators onto an artificial neural network algorithm. They optimized the algorithm through machine learning using real-time data every 5, 10, and 15 minutes from 26 trading days in November and December 2013 on the Brazilian Stock Exchange, similarly confirming the effectiveness of the indicator’s predictions.
Other studies have applied the Aroon indicator to exchange rates and physical commodity prices. For instance, AI Ghamdi Ma combined the Aroon indicator with different technical indicators to analyze the trend changes in the currency market based on predicting future stock patterns.
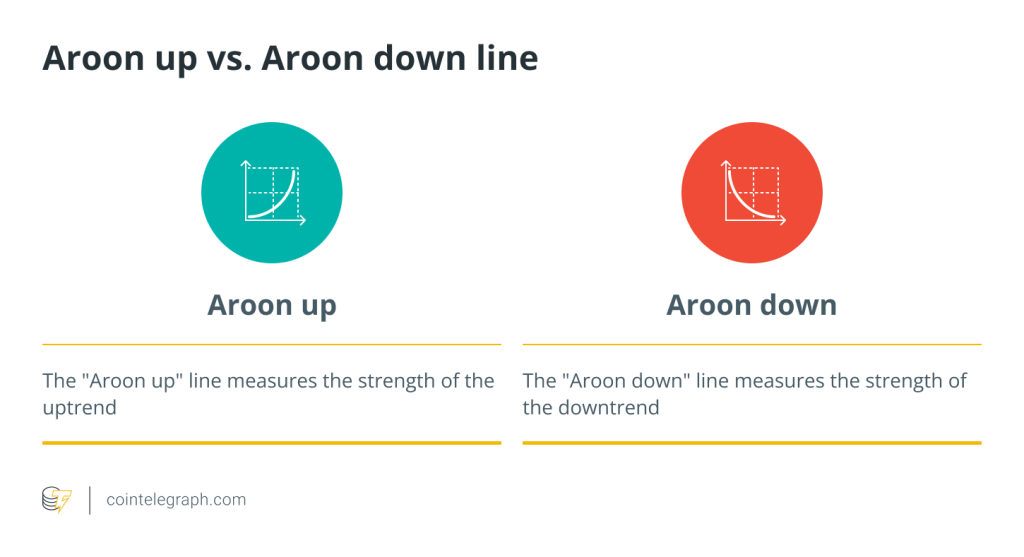
The Aroon indicator system mainly consists of three parts: Aroon_up, Aroon_down, and Aroon Oscillator. The first two are the most commonly used.
How to use the Aroon indicator
The time series data of these three indicators form the Aroon Up line, Aroon Down line, and Aroon Oscillator line. In technical analysis, these lines are used to infer price trends based on their shapes.
For the calculation of the indicator system, the first step is to determine the calculation period. Considering the number of effective trading days in a month and for ease of calculation, a period of 20 or 25 days is usually chosen. Next, it’s necessary to identify the dates within this period when the stock’s highest and lowest prices occurred and record the number of days from these dates to the end of the period. Finally, these numbers are converted into percentages to get the values for Aroon Up and Aroon Down. The difference between these two gives the value of the Aroon Oscillator. The formulas are as follows:
- Aroon_up = [(Number of days in the period – Days since the highest price) / Number of days in the period] x 100
- Aroon_down = [(Number of days in the period – Days since the lowest price) / Number of days in the period] x 100
- Aroon Osc = Aroon up – Aroon down
The range of the Aroon indicator is 0-100. When a new highest or lowest price occurs, the Aroon indicator value increases. When the price remains stable for a long time, the Aroon indicator value gradually decreases. For analysis purposes, 50 is often used as a midpoint, although the Aroon indicator cannot reach exactly 50 (the closest values are 48 and 52). An Aroon value over 52 indicates that a new extreme in price has occurred within the most recent 12 days, suggesting increased market volatility. Similarly, an Aroon value below 48 means that the most recent highest or lowest price occurred at least 13 days ago, indicating relative market stability.
In simple terms:
- Close to or equal to 100 indicates a stronger trend.
- Close to or equal to 0 indicates a weaker trend.
- Around 50 is a middle zone, where the trend could develop in either direction. When Aroon-Up is above 50 and close to 100, and Aroon-Down is below 50, it strongly indicates an upward trend. Similarly, when Aroon-Down is above 50 and close to 100, while Aroon-Up is below 50, a downward trend may emerge.
Application in the Crypto Market:
In the crypto trading market, the formation of new price trends corresponds to the three stages of changes in the Aroon indicator system:
- The Aroon Up line crosses the Aroon Down line.
- The Aroon line crosses the midpoint line of 50.
- The Aroon line reaches the top at 100.
For example, let’s consider the price of BTC:
- An upward trend in the coin price can be indicated when the Aroon Up line crosses over the Aroon Down line, meaning that new highs in the coin price occur more frequently than new lows within the observation period.
- When the Aroon Up line crosses above the midpoint while the Aroon Down line falls below the midpoint, it suggests that the trend is continuing.
- When Aroon Up reaches 100 while Aroon Down remains at a relatively low level, it indicates that a new high in the coin price has occurred without a subsequent downward trend.
- At this point, it can be inferred that the coin price will maintain an upward trend in the short term. Similarly, when the Aroon Down line crosses over the Aroon Up line and then breaks through the midpoint and reaches the top, it suggests a downward trend in the stock price.
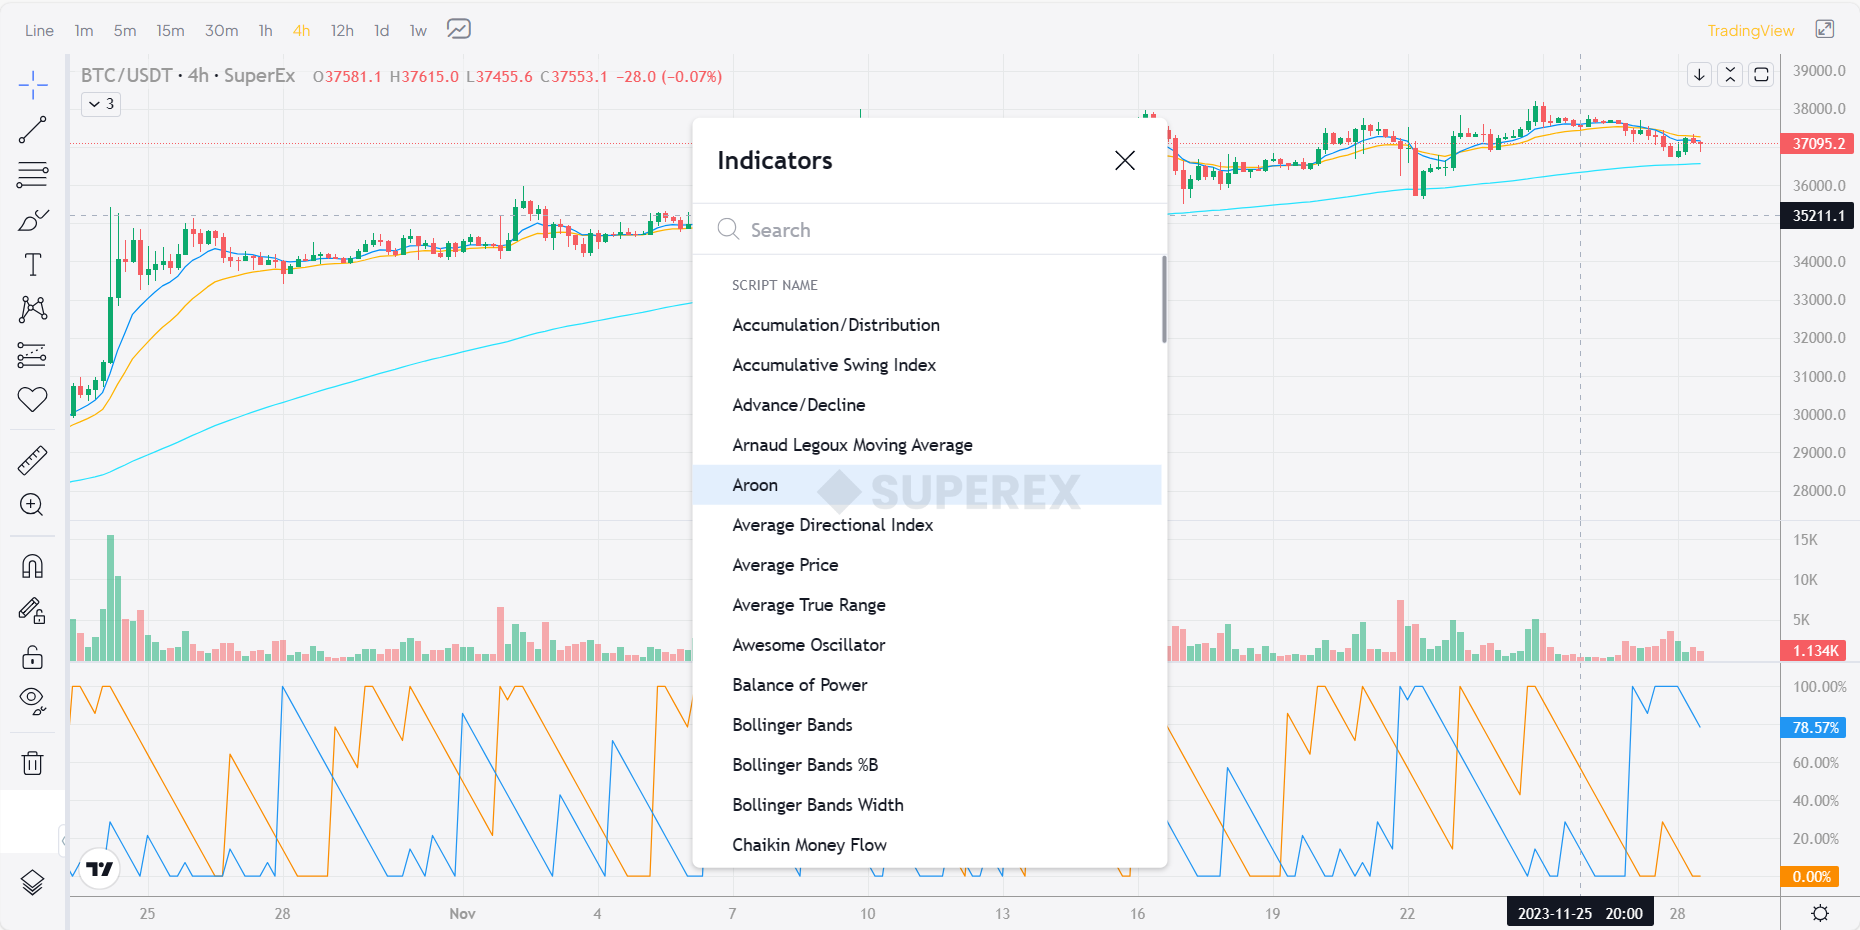
Currently, SuperEx has already drawn the Aroon curve chart for its users, who can directly use it. The specific methods of judgment have been provided below:
- When the Aroon Up line reaches 100, it is considered that the market is in a strong bullish position.
- When the Aroon Up line maintains between 70 and 100, it indicates that the market is in a bullish uptrend.
- When the Aroon Down line reaches 100, the market is in a strong bearish position.
- When the Aroon Down line maintains between 70 and 100, it indicates that the market is in a bearish downtrend.
- When the Aroon Up line touches 0, it suggests that the bulls are in a very weak position.
- When the Aroon Up line maintains between 0 and 30, it indicates that the bulls are in a weaker position.
- When the Aroon Down line reaches 0, it suggests that the bears are in a very weak position.
- When the Aroon Down line maintains between 0 and 30, it indicates that the bears are in a weaker position.
- When both Aroon lines are at the bottom, it indicates that the stock price is consolidating and there is no trend.
- When both the Aroon Up line and the Aroon Down line are below the midpoint and show a parallel downward trend, or both are very low (below 30), it means that the market price is showing a stable trend.
In summary, Aroon Up and Aroon Down are two complementary indicators that jointly measure the time it takes for new price extremes to occur.


-INDEX-IN-3-MINUTES@2x-1024x576-4.png)

Responses