LEARN HULL MOVING AVERAGE IN 3 MINUTES – BLOCKCHAIN 101

Introduction
Hull’s Moving Average (HMA) is a fast, non-lagging moving average.
Guide
Moving averages are an important technical indicator frequently used in technical analysis, but a common issue with simple moving averages is their lag. HMA is a relatively smooth moving average that closely follows price changes, making it widely used in trading. The creator of this indicator is Allan Hull.
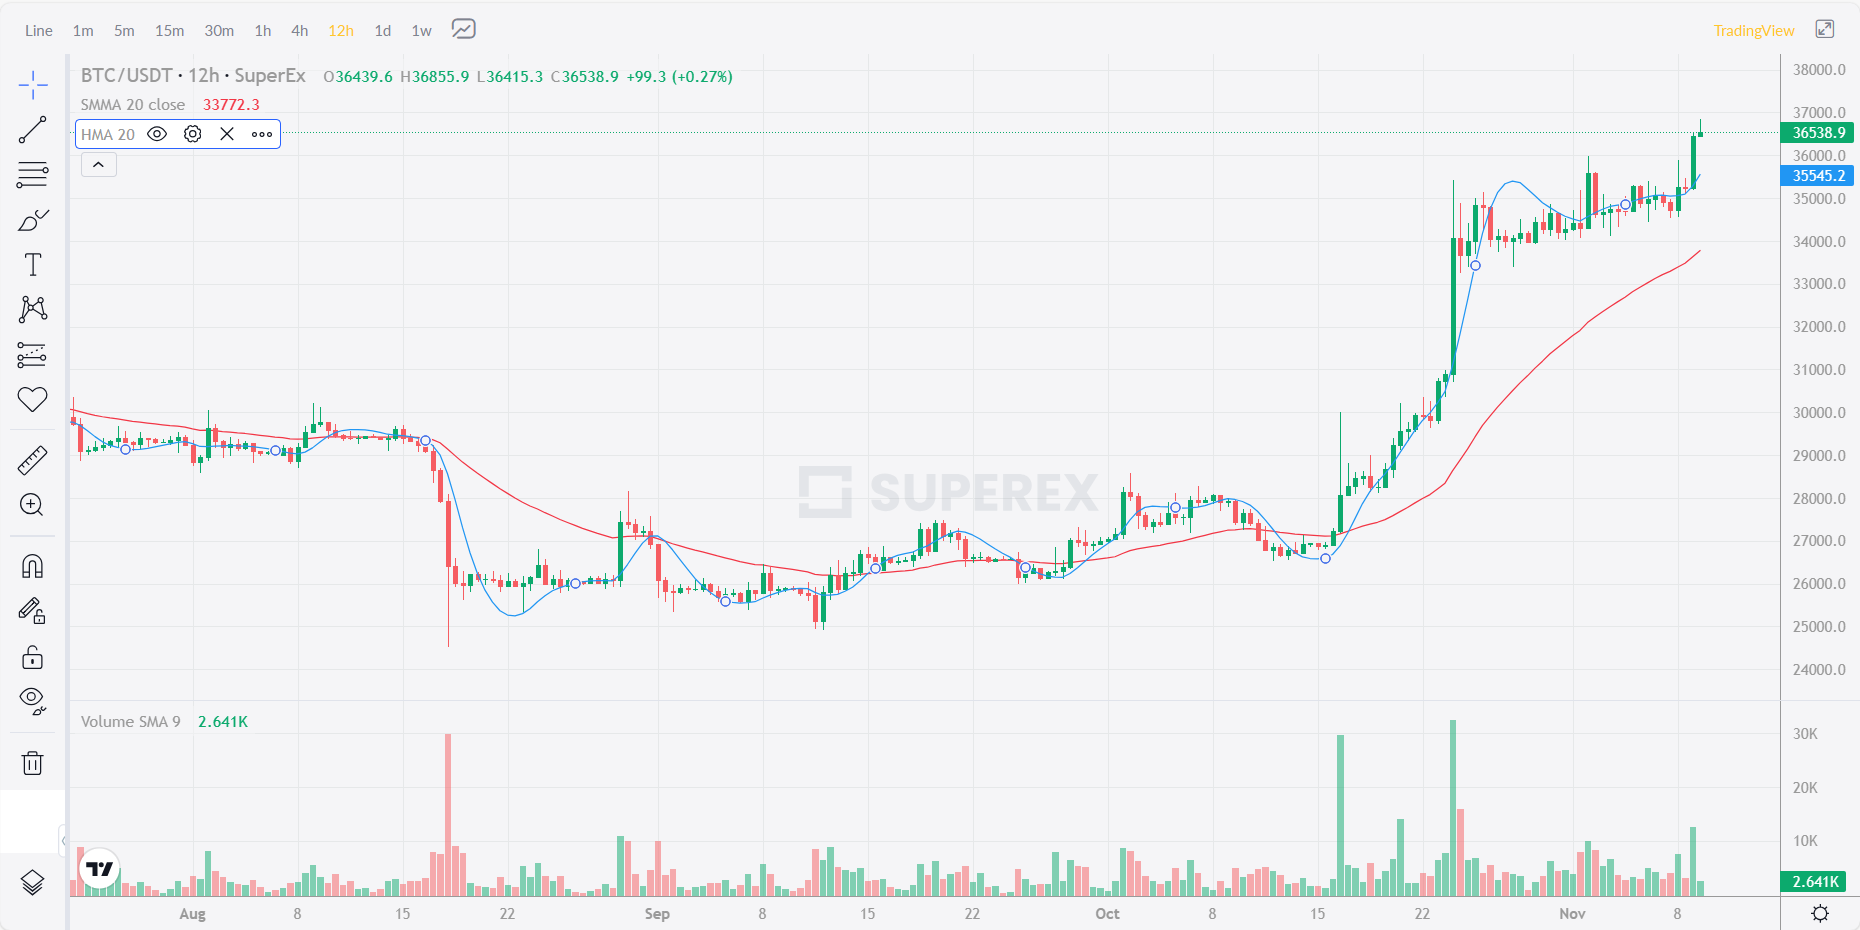
Compared to general moving averages, the HMA has less lag. In the chart below, the red line represents the regular SMA, and the blue line represents the HMA. Both moving averages have a period of 20, and it can be seen that the HMA is more responsive.
Overview of HMA
Traditional moving averages have the drawback that short-period averages (such as 5-day moving averages) are sensitive but not smooth enough, while long-period averages (such as 120-day moving averages) are smooth but react too late to reflect current market changes promptly. The HMA was developed by Alan Hull in 2005 to address these issues. It reduces the lag inherent in traditional moving averages while maintaining their smoothness. This indicator uses weighted moving averages to give higher weight to more recent prices, significantly reducing lag and, as a result, producing a more responsive moving average.
The Weighted Moving Average (WMA) function:
Meaning: Returns the weighted moving average.
Usage: WMA(X, N) represents the N-day weighted moving average of X, with the formula Yn = (1X1 + 2X2 + … + nXn) / (1 + 2 + … + n).
Example: If the closing prices for the last five days were 11, 12, 13, 14, 15
WMA5 = 1*11 + 2*12 + 3*13 + 4*14 + 5*15 = 13.66
This formula shows that the closer to the current day, the higher the weight, making the result closer to the current price.
Explanation of the Hull Moving Average (HMA) principle:
To calculate the Hull Moving Average, first define a parameter N. Then calculate N/2 and the square root of N. Using these values, calculate the difference between two WMA lines of different periods and smooth it out to obtain the HMA.
The mathematical expressions for these steps are:
- P1 = Period Selected by a user
- P2 = P1 / 2
- P3 = Square Root of P1
- MMA = 2 x WMA(Price, P2) – WMA(Price, P1)
- Hull MA = WMA(MMA, P3)
Practical Example
For N=20, N/2 is 10, and the square root of N rounded is approximately 4
1. Calculate the 10-day WMA (WMA10) and the 20-day WMA (WMA20).
WMA10: WMA(C,10);
WMA20: WMA(C,20);
2. Multiply WMA10 by 2 and subtract WMA20 to get the unsmoothed Hull Moving Average (RHMA).
RHMA: 2*WMA10 – WMA20;
Reformulating the unsmoothed RHMA:
RHMA: WMA10 + (WMA10 – WMA20);
- When the WMA10 is above WMA20, WMA10 – WMA20 is greater than 0, and RHMA will be higher than WMA10;
- When WMA10 is below WMA20, WMA10 – WMA20 is less than 0, and RHMA will be lower than WMA10.
3. Smooth the unsmoothed RHMA with the WMA function to obtain HMA
The square root of N is rounded up to equal 4, so the HMA formula is as follows:
HMA:WMA(RHMA,4),COLORRED,LINETHICK2;
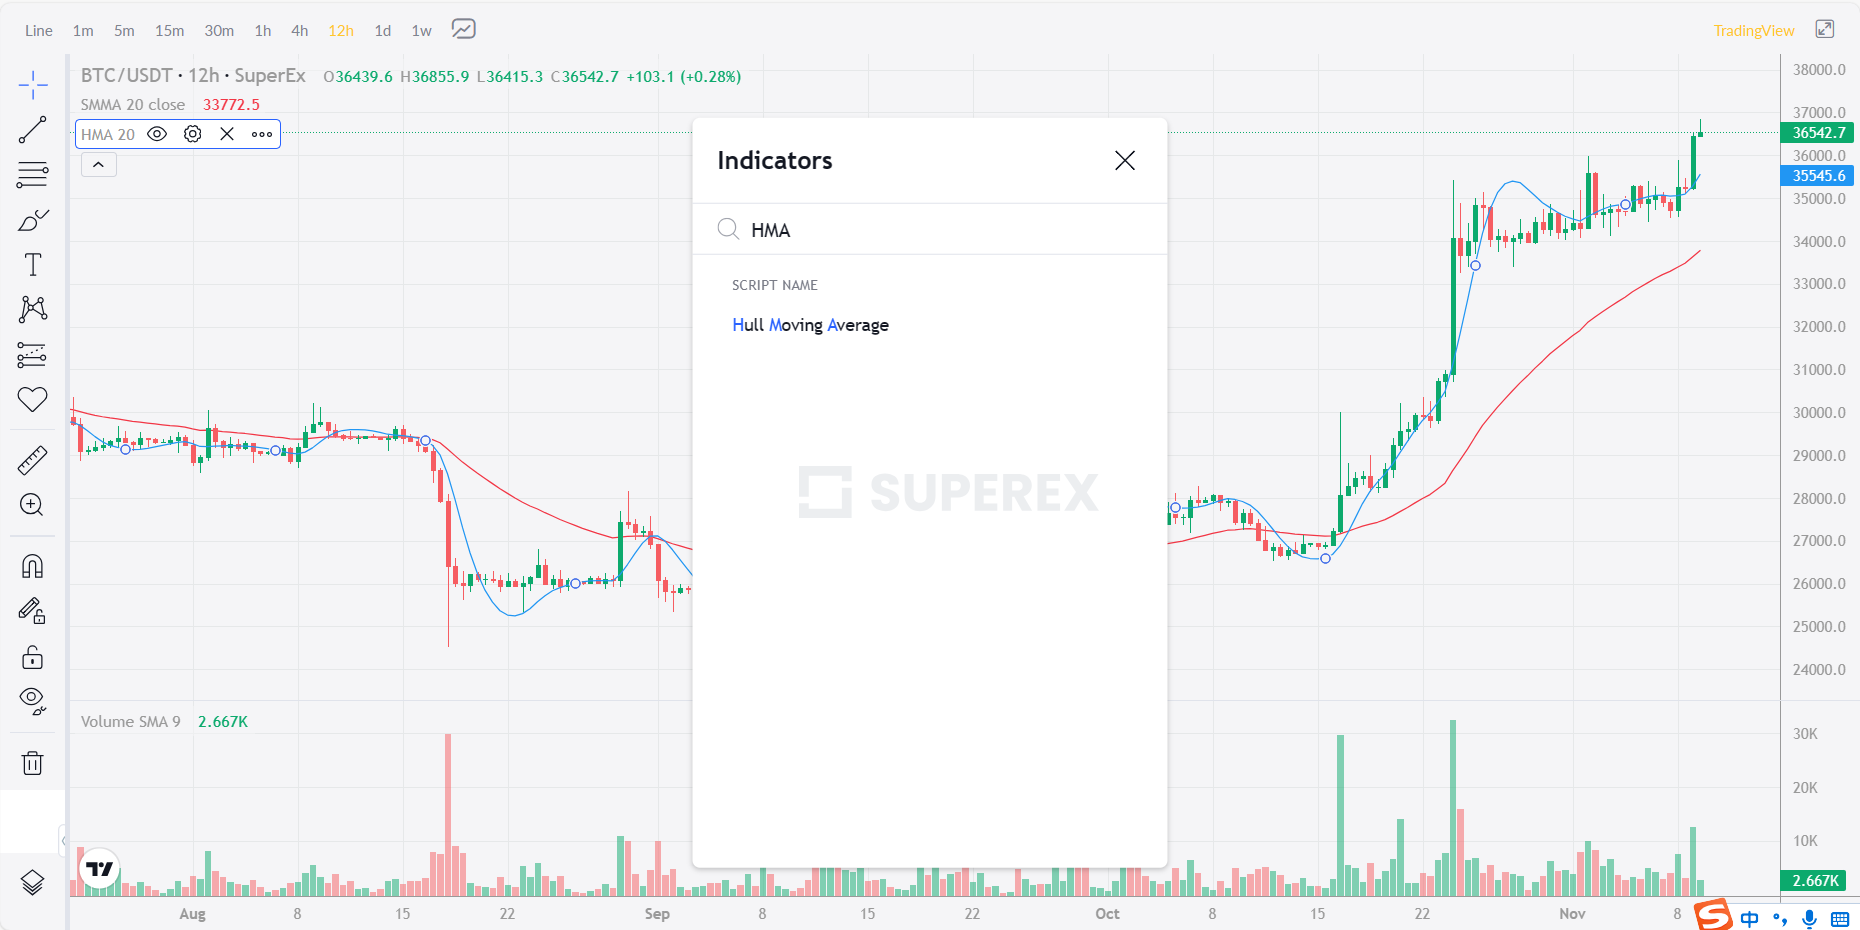
SuperEx comes with a graph of the HMA average, so the formula is simple to understand, and we can find it by typing the initials “H/M/A” in the Indicator Market, as shown below:
Usage of the Hull Moving Average (HMA)
The usage of the Hull Moving Average (HMA) is similar to that of the Simple Moving Average (SMA). Here are some key points about its application:
- Trend Direction: The HMA is used to determine the direction of a price trend. If the HMA is rising, it indicates an upward price trend. Conversely, if the HMA is declining, it suggests a downward price trend. When the HMA is flat, it implies that there is no clear trend in the market.
- Nature of the Indicator: The HMA is fundamentally a type of moving average, much like the SMA (Simple Moving Average), EMA (Exponential Moving Average), WMA (Weighted Moving Average), and FRAMA (Fractal Adaptive Moving Average). The key difference lies in the method of calculation rather than the underlying concept.
- Importance of Moving Averages in Technical Analysis: Many technical indicators and trading methodologies utilize moving averages. This is because moving averages reflect trends, which are central to technical analysis. Most trading strategies, methods, and systems are designed to follow trends. As such, the analysis of the emergence, development, and conclusion of trends is a core aspect of technical analysis.
In summary, the HMA is a valuable tool in technical analysis for identifying and tracking market trends. It offers a unique way of smoothing price data and reacting faster to market changes compared to some other types of moving averages, which makes it a preferred choice for traders who rely heavily on trend analysis.


Responses