LEARN MOVING AVERAGE CONVERGENCE DIVERGENCE(MACD) IN 3 MINUTES – BLOCKCHAIN 101
In secondary market investment, the MACD indicator, as a means of technical analysis, has been recognized by investors. In practice, the MACD indicator protects investor interests far more than its effectiveness in identifying investment opportunities, earning it the title of “King of Indicators”. However, few know how to use the MACD indicator to maximize investment returns.
The full name of MACD is Moving Average Convergence Divergence, an oscillating type of indicator widely used by traders for technical analysis (TA).
As a trend tracking tool, the MACD uses moving averages to determine the trend of stocks, cryptocurrencies, or other tradable assets.
The Moving Average Convergence Divergence indicator, developed by Gerald Appel in the late 1970s, records past price changes and hence belongs to the lagging category of indicators (providing trading signals based on past price behavior or data). Its design is based on the principle of moving averages, a type of trending indicator after smoothing the closing price (calculating the weighted average). The MACD indicator uses the convergence and divergence conditions between the short-term (usually 12 days) moving average and the long-term (usually 26 days) moving average to judge the timing of buying and selling.

Importance of the MACD Indicator
- The MACD indicator is the default preferred indicator in major stock and crypto markets.
- The MACD indicator is, of course, the most widely used indicator, proven by history to be the most effective and practical indicator.
- The MACD indicator is an oscillating indicator calculated from the trend-based EMA, and it works well in both trending and oscillating markets.
- Divergence in the MACD indicator is considered one of the best “buy low, sell high” technical analysis methods.
- The MACD indicator is the first choice for beginners, it’s the starting point for many investors to study indicators. Even after exploring other indicators, creating their own or using combinations of indicators, many eventually return to their original choice and continue using the MACD as their ultimate indicator.
- The MACD indicator is one of the most common entry and exit bases for systematic traders, widely used to judge buying and selling points as well as market bullish and bearish conditions.
Composition of the MACD Indicator
The MACD is composed of two parts, namely, the positive and negative difference (DIF), and the signal line (DEA), among which, DIF is the core, and DEA is auxiliary. DIF is the difference between the fast exponential moving average (EMA1) and the slow exponential moving average (EMA2).
One advantage of MACD is that it discards the drawback of MA (Moving Average) frequently issuing buy and sell signals, making the signal requirements and restrictions more stringent, thus being more stable to use in practice than MA. However, like MA, the MACD has a disadvantage when the market is flat or in a range; due to the dulling of the indicator, it can easily produce false signals and issue incorrect instructions.
MACD Parameter Settings
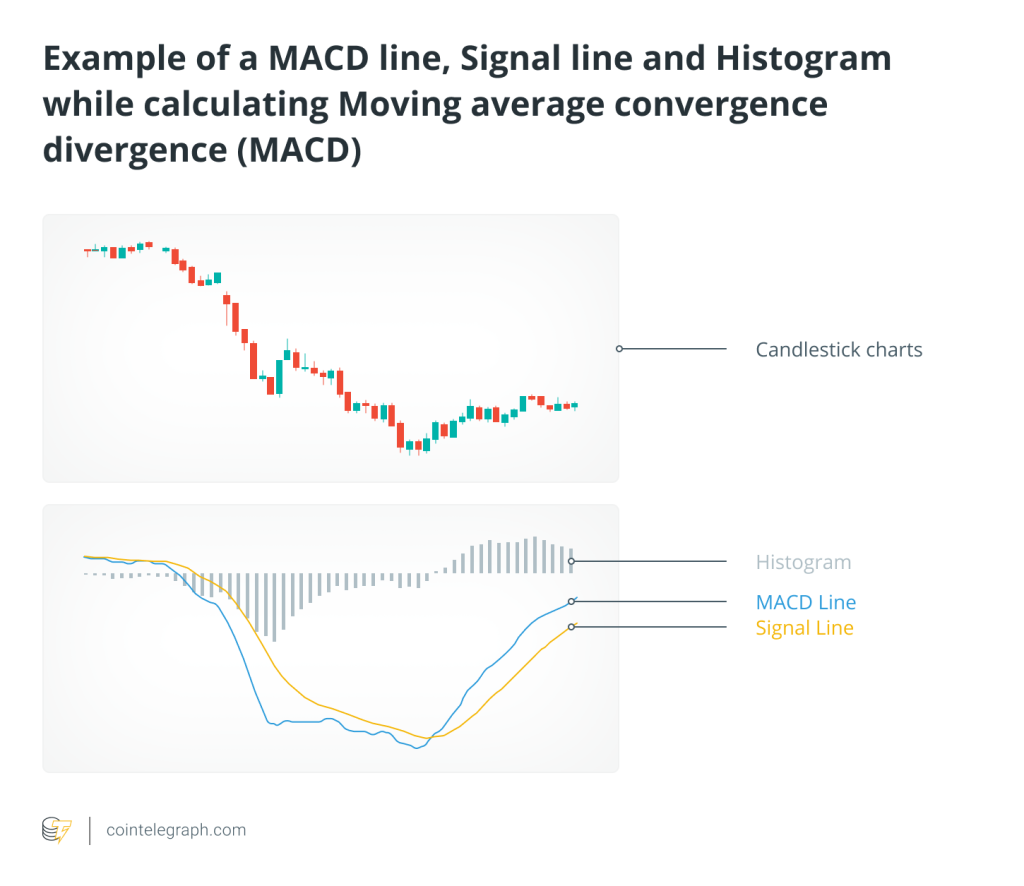
The fast exponential moving average parameter (DIF) is 12, the slow exponential moving average parameter (DEA) is 26. In addition, the MACD has an auxiliary indicator – the histogram (BAR). As shown below.
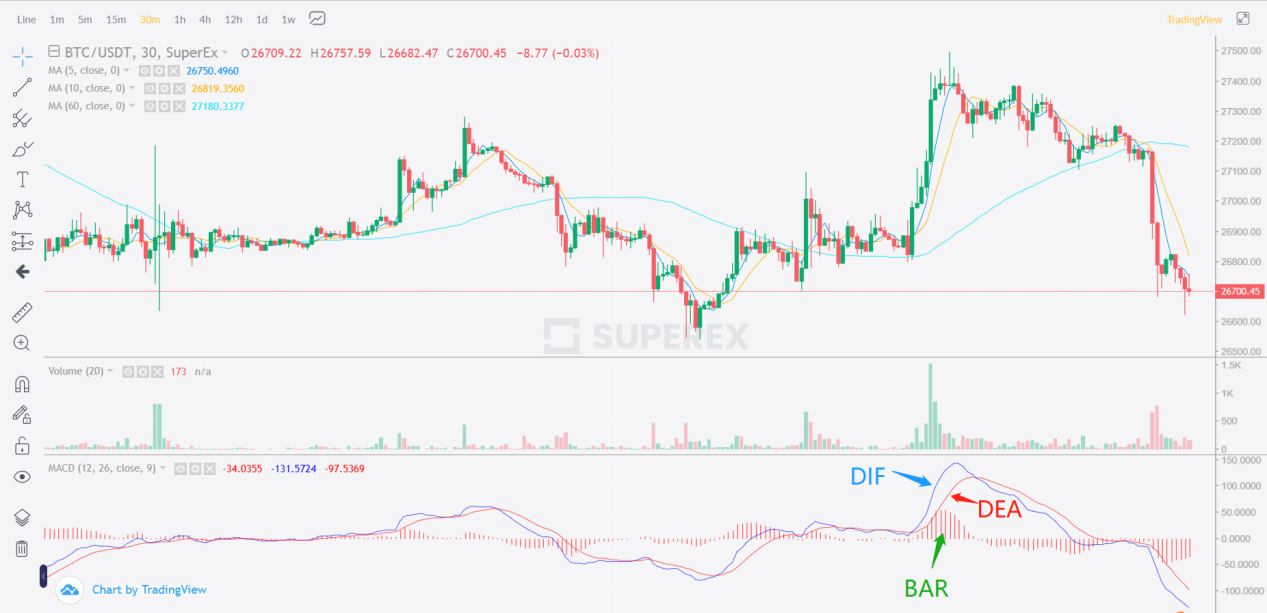
MACD Practical ApplicationIn application, the MACD first calculates the fast moving average (i.e., the 12-day EMA1) and the slow moving average (i.e., the 26-day EMA2). The difference between these two values results in the DIF. Then, the 9-day smoothed moving average DEA of the DIF is obtained. Finally, the value of the MACD is calculated according to the formula “MACD = 2×(DIF-DEA)”.
Of course, if you’re using SuperEx for trading, there’s no need to set up the MACD. The default settings for the MACD in SuperEx are correct and can be used directly.
MACD Practical Operation
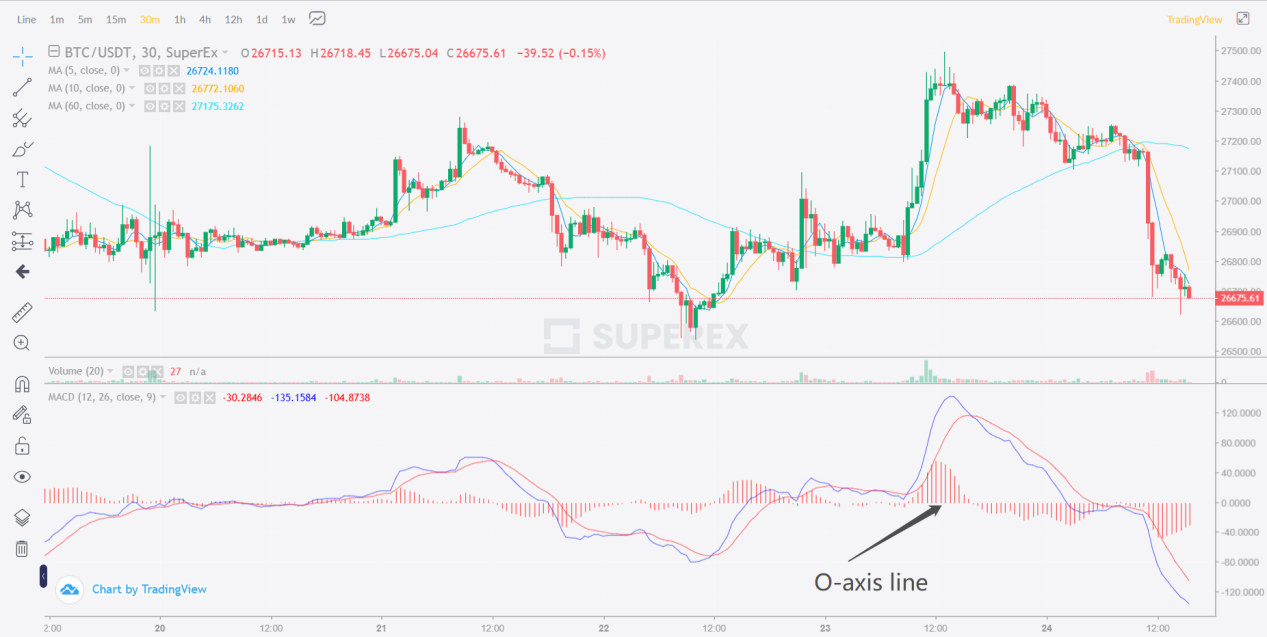
The application of the MACD indicator is very simple, just remember one rule of thumb: the relationship between a benchmark and two lines. Here, the benchmark refers to the zero axis, and the two lines refer to the DIF and DEA lines, also known as the fast line and slow line. Next, we will directly describe the four methods of the intersection relationship between the fast line and the slow line on the zero axis.
Term Explanation
- Zero Axis: The dividing line for BAR to move up and down is the zero axis.
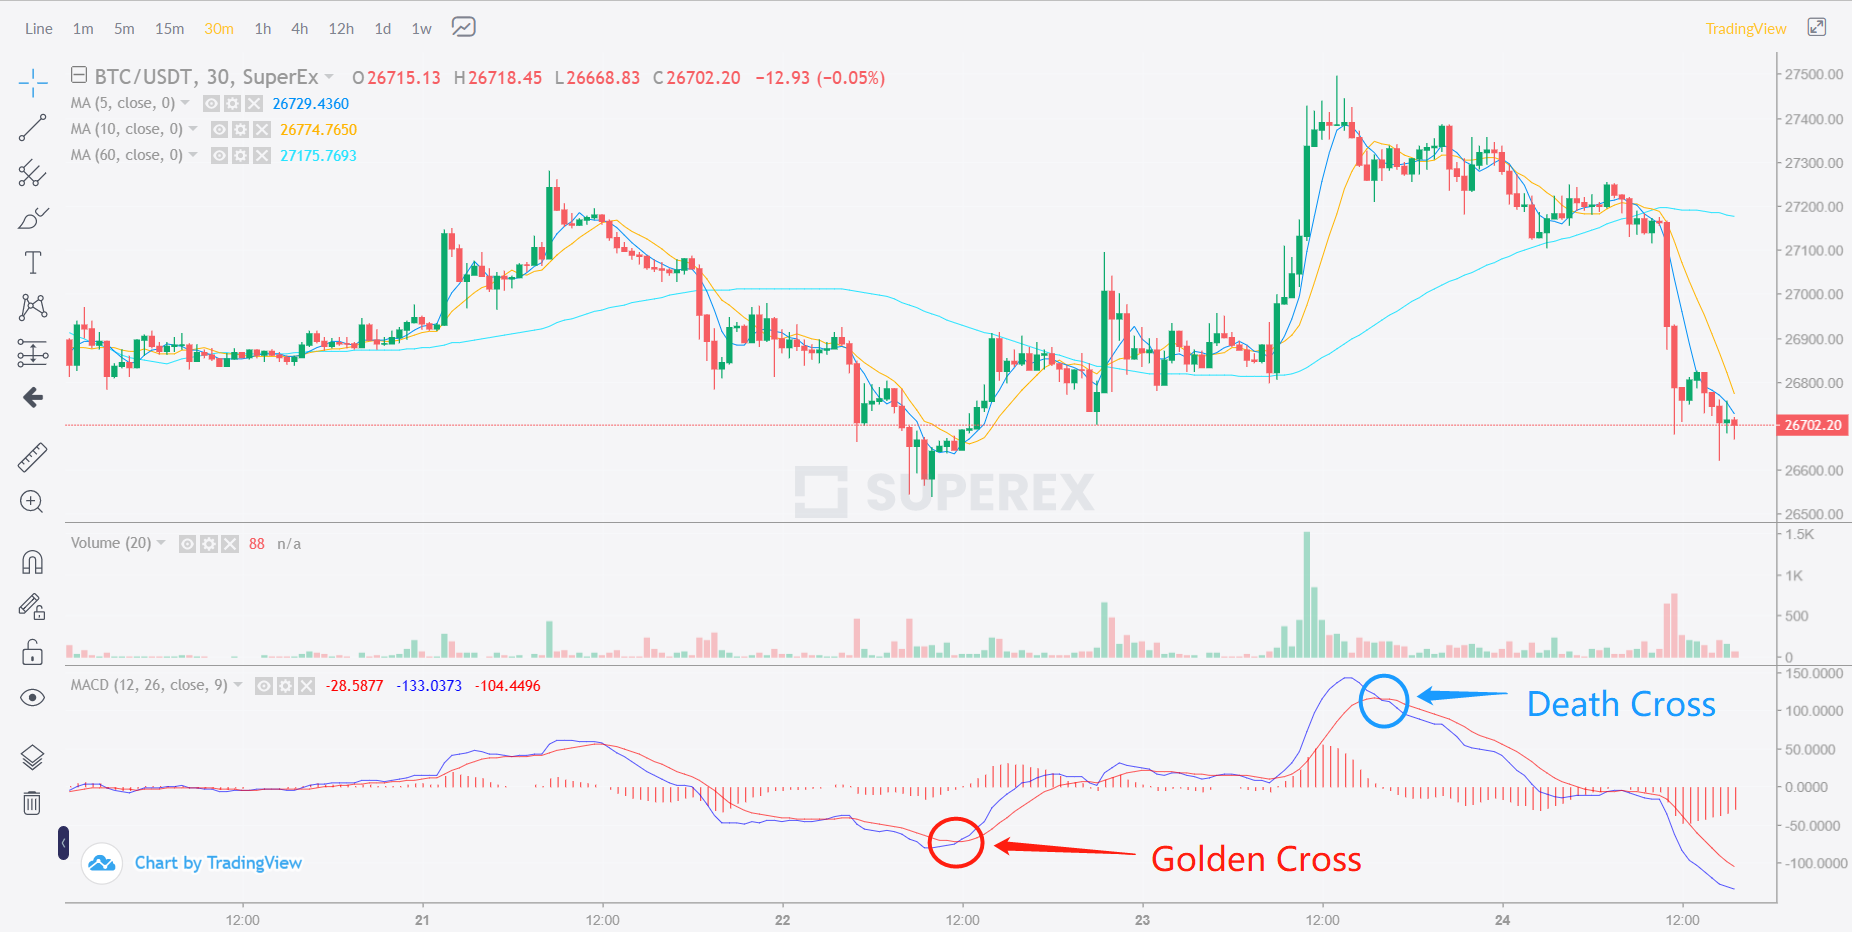
- Golden Cross: The pattern when the fast line intersects the slow line moving upwards.
- Death Cross: The pattern when the fast line intersects the slow line moving downwards.
- Divergence: The trend of the fast line and slow line is not synchronized with the price trend.

Practical Operation
When DIF and DEA are above the zero axis:
When MACD forms a golden cross, it’s the golden cross above the zero axis. The coin price runs upward with the market trend. At this time, the overall market forms a bullish arrangement, which is a signal for bullish buying.
When MACD forms a death cross, it’s the death cross above the zero axis. At this time, the market is mainly about washing the plate, that is, it’s not the beginning of the trend reversal, but the main force is trying to suppress the price to wash the retail investors. There’s no need to be too afraid. If the recent momentum looks good, you can hold positions and ignore short-term fluctuations. If the fluctuations are too large, you should reduce positions and watch.
When DIF and DEA are below the zero axis:
When MACD forms a death cross, it’s the death cross below the zero axis. At this time, the market is in a bearish downward trend, try to sell and wait and see. The overall market performance is a rapid downward fluctuation in the short-term price.
When MACD forms a golden cross, it’s the golden cross below the zero axis. At this time, the market is mainly rebounding upwards. Although there is a rebound, it’s also similar to the last throes. The bullish momentum is declining, and the bearish momentum is strong. If you have been trapped before this, try to leave the market in a market turnaround to reduce unnecessary losses.
Top Divergence and Bottom Divergence
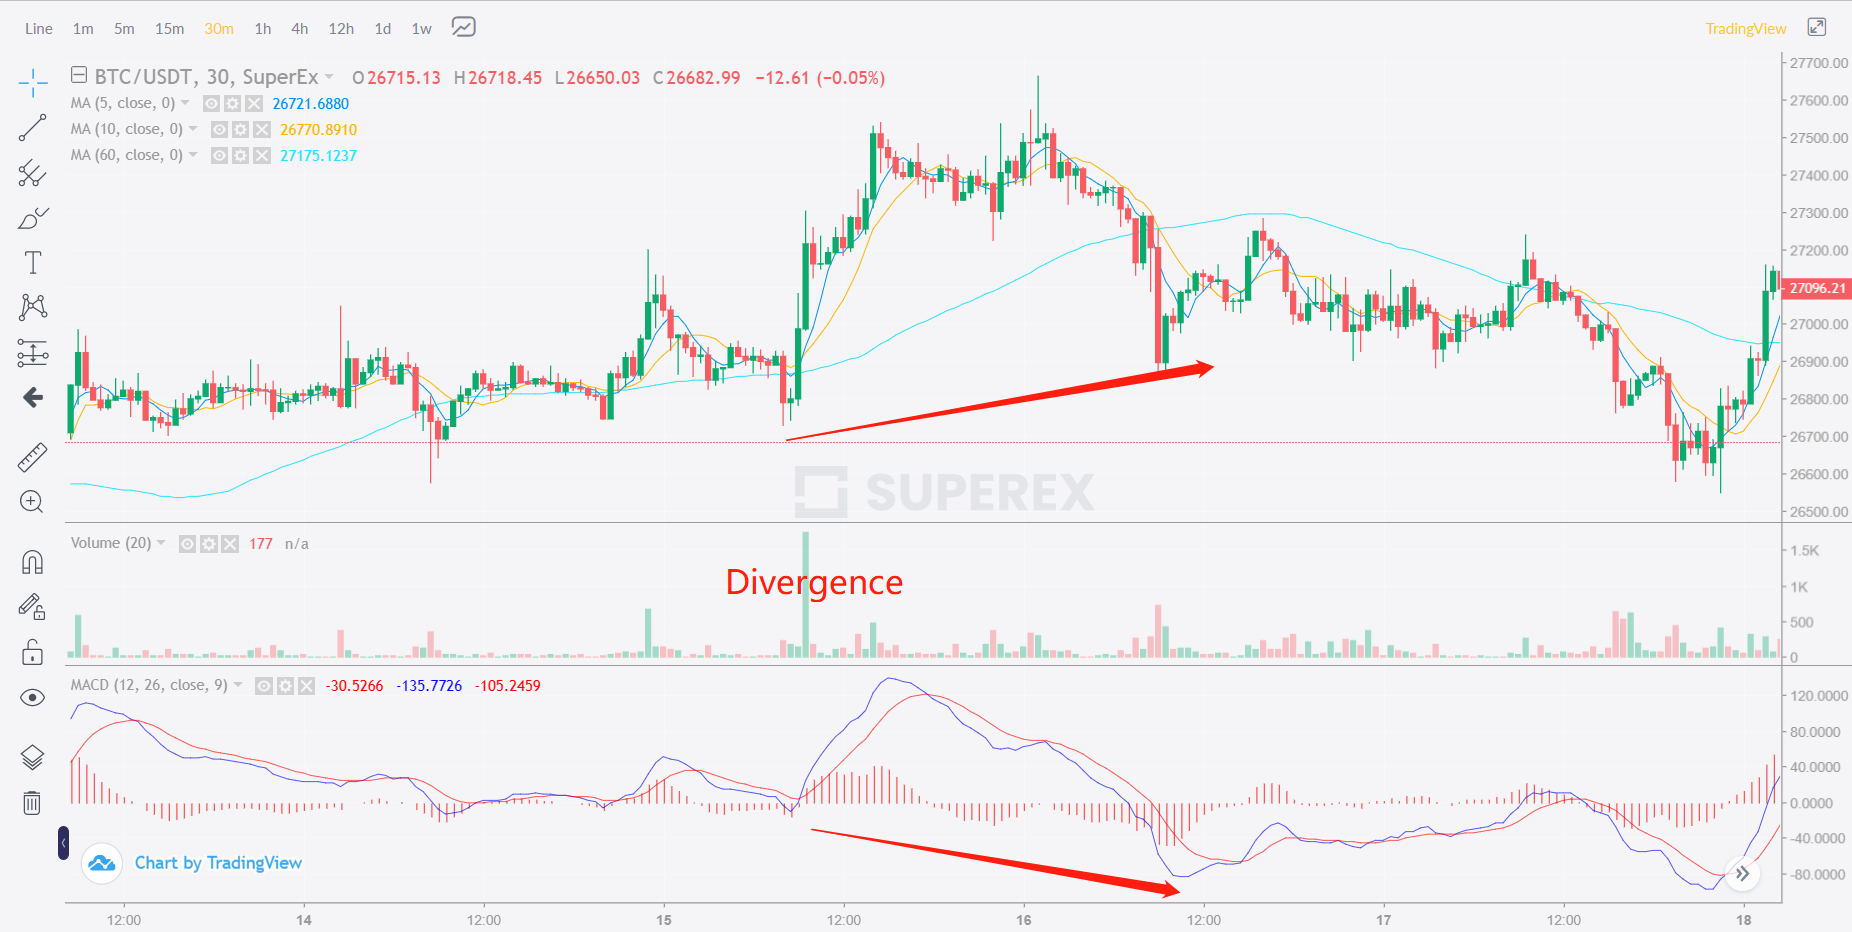
The divergence of MACD from price, also known as the divergence of exponential smoothing average from price, is characterized by: the price rises wave by wave, but the MACD technical indicator does not rise synchronously, but falls wave by wave. The figure of MACD divergence from price top is shown in the figure below.

Technically speaking, the divergence of MACD from price top indicates that a round of price rise has been completed, and it is likely to reach its peak in the short term, especially after the price has been significantly increased. If the MACD shows a death cross, the possibility of a significant drop after reaching the top is even greater. Investors should be prepared to exit the market or reduce their positions at this time. Once the price trend is downward, decisively clear positions. The above figure reflects this very well. After BTC is in a divergent form, the price quickly reaches the high point, and then drops significantly after reaching the top.
The pattern of bottom divergence is just the opposite of top divergence. Its characteristic is: the price falls wave by wave, but the MACD indicator line does not fall synchronously, but rises wave by wave. The figure of MACD divergence from the price bottom is shown in the figure below.
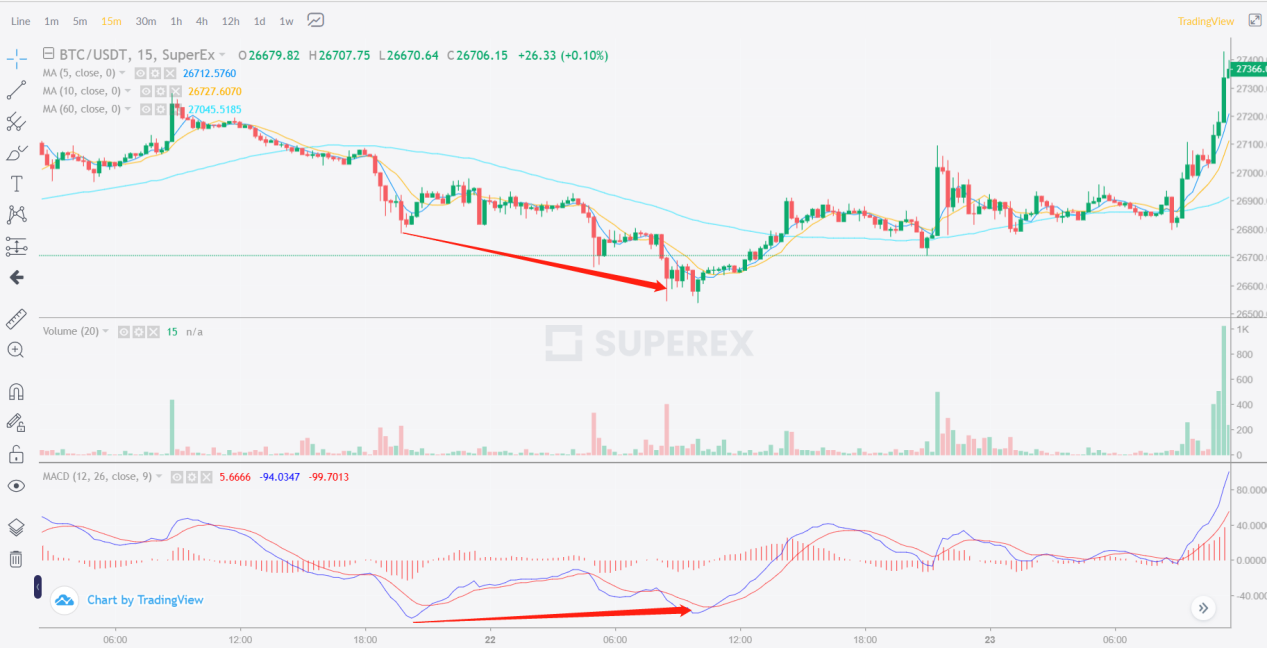
Technically speaking, the divergence of MACD from the price bottom suggests that a round of price declines has been completed, and it is likely to bottom out in the short term, especially after the price has significantly fallen. If the MACD shows a golden cross, the possibility of bouncing back after hitting the bottom is greater. At this time, investors should be prepared to enter the market, or they can use a small amount of capital to enter the market first.
MACD Indicator Rules:
- When a golden cross is formed in the MACD indicator, it is a buy signal. The higher the position of the golden cross, the stronger the buy signal. A golden cross above the zero line indicates a strong signal, and a golden cross below the zero line indicates a weak signal.
- When a death cross is formed in the MACD indicator, it is a sell signal. The lower the position of the death cross, the stronger the sell signal. A death cross above the zero line is a weak signal, and a death cross below the zero line is a strong signal.
In actual operation, the MACD is not only capable of capturing strong rise points for beginners, but also has the characteristic of bottoming out. It not only gives buy points but also sell points, reflecting the golden cross and the death cross, but these are the necessary paths for high-tech analysis. Understanding it greatly increases the probability of success for beginners.


Responses