BTC price dices with $52K as CME Bitcoin futures OI hits record $6.8B

Bitcoin open interest suggests the potential for fresh volatility as BTC price support levels become clear for the weekly candle close.

Bitcoin (BTC) returned to the center of an intraday trading range into the Feb. 18 weekly close as bulls profited from weekend trading.

Trader: Bitcoin rally “healthy” despite OI surge
Data from Cointelegraph Markets Pro and TradingView showed $52,000 acting as a focal point for BTC price consolidation.
The largest cryptocurrency saw a dip to $50,680 on Bitstamp the day prior, marking its lowest levels in several days.
A swift rebound added nearly $1,500 in the hours that followed, however, and at the time of writing, the lows had not seen a fresh retest.
Analyzing the week’s action, popular trader Skew flagged a change in trader behavior in the latter half of the Wall Street trading week.
Spot buying, he revealed, had subsided toward the weekend, with “mostly taker driven dips & bounces since.”
“So far seeing some spot buyers return here with binance spot leading,” he wrote on the day.
$BTC Market thread continued, in partnership with @_WOO_X $BTC Aggregate CVDs & Delta
Using Spot CVD here we can see notable divergences with price which I’ve marked out as red circles (limit selling into price)On LTF there was a change in flow around the 15th – 16th which is… https://t.co/tDAJYsrw5I pic.twitter.com/mJLgKJnPst
— Skew Δ (@52kskew) February 18, 2024
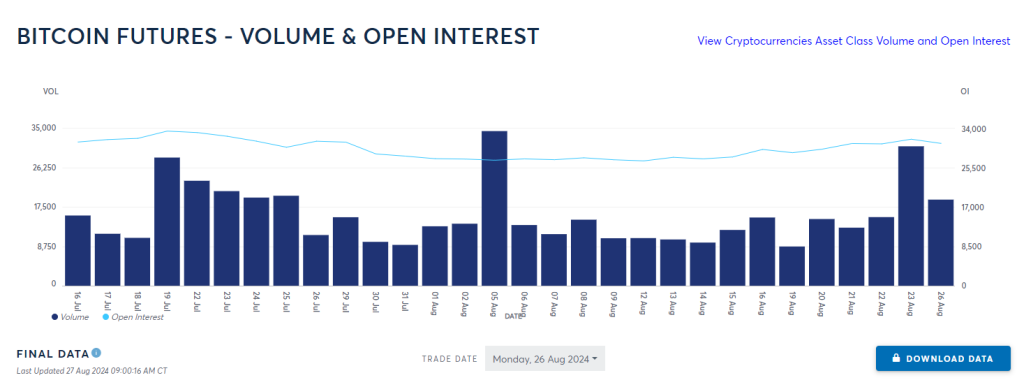
Meanwhile, burgeoning open interest (OI) on CME Group’s Bitcoin futures markets hitting a record $6.8 billion was indicative of volatility to come, per data from monitoring resource CoinGlass.

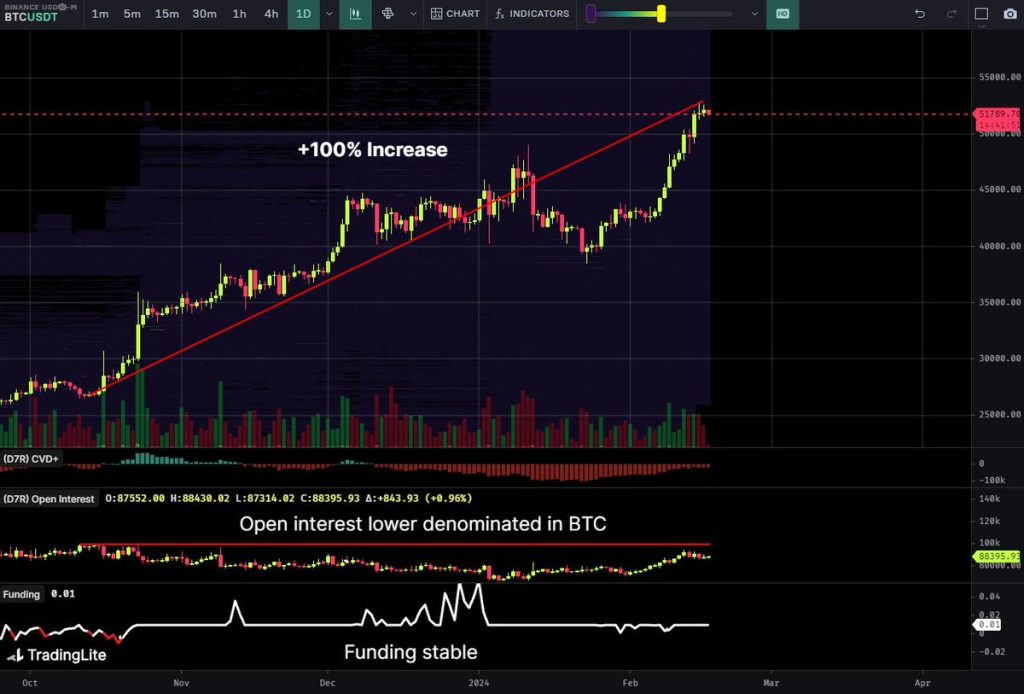
Discussing open interest more broadly, however, popular trader Daan Crypto Trades noted a divergence when this was denominated in BTC.
“This +100% rally from October has been healthy in terms of leverage imo,” he argued.
“Funding has mostly kept it’s neutral rate and open interested denominated in $BTC is lower. In USD value of course it has gone up during this time as the underlying asset (BTC) went up in value.”

Key BTC price weekly close levels emerge
Continuing, Skew said that bulls needed to preserve upward momentum in Bitcoin’s relative strength index (RSI) on 4-hour timeframes into the weekly close.
Related: Bitcoin is now at or near all-time highs in these 5 fiat currencies
The 21-period exponential moving average (EMA), currently at $51,500, was also important.
“In terms of spot flows around $52K – $53K area, notable spot selling into bounces which is often the case with profit taking,” he explained about the landscape on Binance.
“Key from here with current uptrend is seeing sufficient spot demand on dips, mostly seen as absorption at the lows where limit buying outweighs taker selling.”
#BTC Weekly close above $49k and it is Bullish
Close below and $44k comes into play to start, simple as that pic.twitter.com/sL0HOh1giX
— Matthew Hyland (@MatthewHyland_) February 17, 2024
Fellow trader and analyst Matthew Hyland highlighted $49,000 as the ultimate line in the sand to protect for the close.
This article does not contain investment advice or recommendations. Every investment and trading move involves risk, and readers should conduct their own research when making a decision.


Responses