LEARN CHOPPINESS INDEX IN 3 MINUTES – BLOCKCHAIN 101
Guide
Trend is the general direction that all traders are pursuing, follow the trend to do trading is like standing in the wind, no adverse, but the trading market is the battlefield of buyers and sellers, full of uncertainty, for example: the uncertainty of the amount of funds, the uncertainty of the ups and downs, the uncertainty of the trend of the early judgement.
What is less well known is that even if a particular coin goes out of an uptrend, it is not foolproof, and there is instability in the trend! Mastering the judgement of trend instability is very important for traders. This lesson brings you an indicator that measures the stability or instability of a market trend: the CHOPPINESS INDEX (CI).

CHOPPINESS INDEX (CI) Introduction
The Choppiness Index indicator, abbreviated as CI indicator, was created by Bill Dreiss, an American technical analysis expert, trader and author, who developed this indicator in the 1980s with the initial intention of quantifying market trends or sideways states to help traders better understand the dynamic nature of the market.
It was later tested and refined by the market to form the current CI indicator, which can be used to measure the stability or instability of a market trend.
The Choppiness Index is calculated based on the cumulative sum of the True Range and a time period set by the user (usually 14). The formula is as follows:
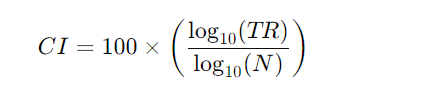
Among them:
TR is the cumulative sum of the difference between the highest and lowest prices, i.e. the true range.
N is the set time period.
Interpretation of Choppiness Index:
The Choppiness Index ranges from 0 to 100. It is interpreted in the following way:
A low value (close to 0): indicates that the market is trending, with large price fluctuations over a relatively long period of time.
Higher values (close to 100): indicate a sideways market with less volatility over a longer period of time.
Purpose of using Choppiness Index:
Market State Determination: To help traders determine whether the market is trending or moving sideways so that they can adjust their trading strategies accordingly.
Trading Strategy Selection: In a trending market, a trend-following strategy may be more effective; in a sideways market, a reversal or oscillator strategy may be more appropriate.
Use Case:
Trending Markets: With a low Choppiness Index, traders may want to consider using a trend following strategy.
Sideways market: With a high Choppiness Index, traders may consider using a reversal or oscillator strategy.
Additional Notes:
- Market Adaptability:The Choppiness Index is considered to be a market-adaptive indicator because it helps traders adjust their trading strategies to the actual state of the market. This adaptability is one of the reasons for its popularity.
- Volatility and smoothness trade-off:The Choppiness Index is designed to balance the volatility and smoothness characteristics of the market. By measuring price fluctuations, it helps to determine the current dynamics of the market.
- Choice of time period:The Choppiness Index is calculated using a user-defined time period (usually 14). Different time periods may lead to different results, so traders may need to select the appropriate period based on their trading style and market objectives.
- Applications: The Choppiness Index can be applied to a variety of markets, including equities, futures, and crypto markets. Its universality makes it useful across asset classes and market conditions.
- Trend and sideways sensitivity:The Choppiness Index is very sensitive to shifts in trending and sideways markets. Traders can capture changes in market conditions by observing changes in its value.
Overall, the Choppiness Index, as a tool to quantify market trends and volatility, provides traders with an easy and intuitive way to determine the current state of the market. However, as with any technical indicator, it should be used as part of a comprehensive analysis in conjunction with other indicators and trading plans to improve the accuracy of your decision making.


Responses