Bitcoin price holds $52K even as Fed rate cut odds drop

Bitcoin bulls get no help from the latest U.S. macro data as $52,000 forms sturdy BTC price resistance.

Bitcoin (BTC) stuck to $52,000 at the Feb. 16 Wall Street open as the latest United States macro data ran above expectations.

PPI offers no relief for Bitcoin, risk assets
Data from Cointelegraph Markets Pro and TradingView showed stagnant BTC price action into the week鈥檚 last TradFi trading session.
Following hot on the heels of the Consumer Price Index (CPI) print two days prior, the Producer Price Index (PPI) numbers for January added to the U.S. inflation headache.
Year-on-year, PPI came in at 0.9% 鈥?fractionally lower than a month prior but still 0.3% above market forecasts.
Together with 鈥渉ot鈥?CPI, the result thus made markets even more timid about when the Federal Reserve could ease fiscal policy this year.
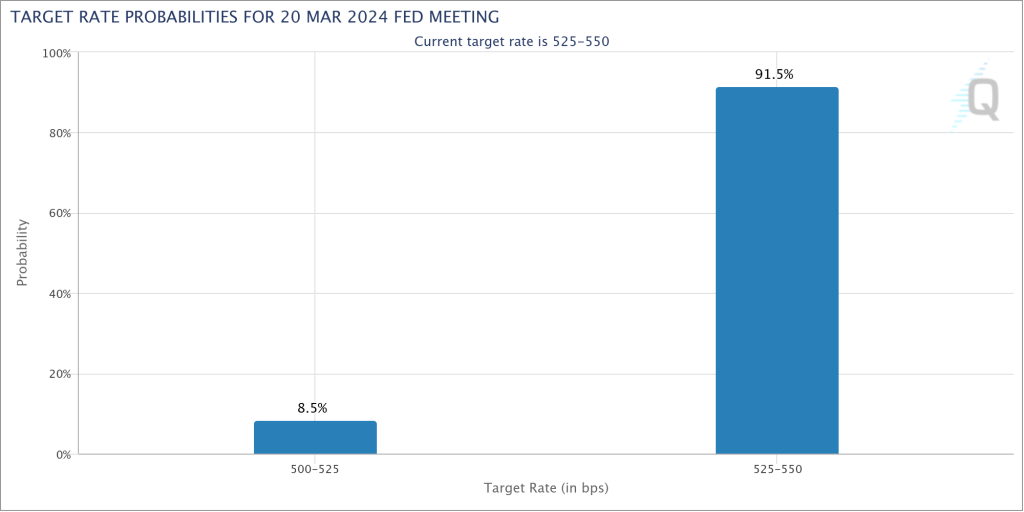
Per data from CME Group鈥檚 FedWatch Tool, the odds of the Fed cutting interest rates at its March meeting were at 8.5% at the time of writing 鈥?less than half the 17.5% chances at the start of the week.

鈥淎 March interest rate cut is likely completely ruled out after this data,鈥?trading resource The Kobeissi Letter wrote in part of a response on X (formerly Twitter), reinforcing its reaction to CPI.
鈥淔urthermore, a May rate cut has become questionable as well.鈥?/blockquote>
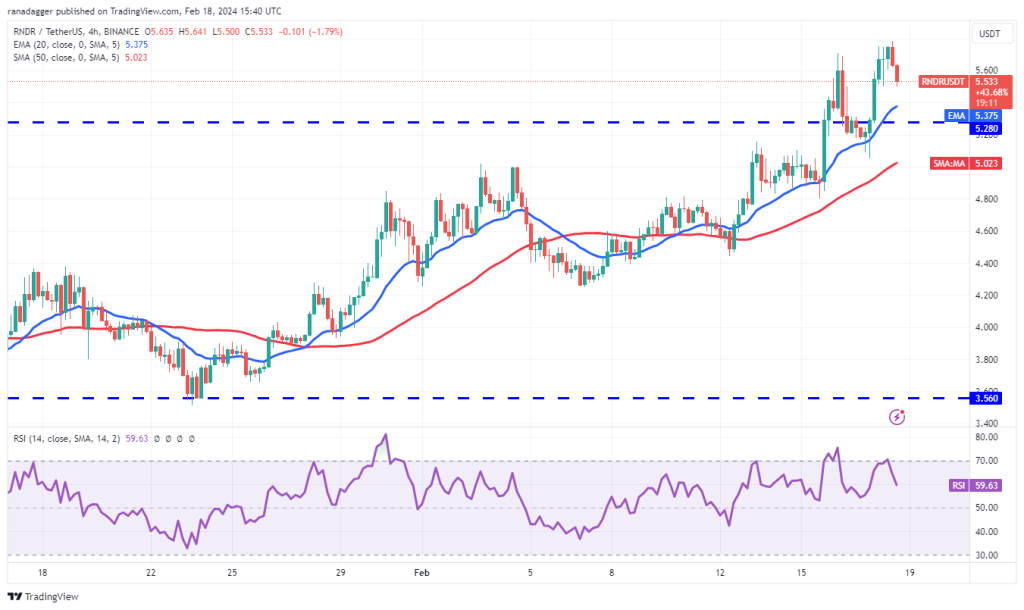
$BTC 4H
Choppy price action here with a lot of inside bar closes basically within the same intraday balanceoften there’s a fakeout before the real expansive move
4H 21EMA ~ $51K
Weekly open & main 4H trend ~ $48K – $47K
(key HTF area & systematic area) pic.twitter.com/G75BeREfnE鈥?Skew 螖 (@52kskew) February 16, 2024
Bitcoin itself hit $52,884 on Bitstamp the day prior, its highest level since late November 2021, but bulls faced pressure from sellers.
Analyzing four-hour timeframes, popular trader Skew noted the significance of the 21-period exponential moving average (EMA), currently at around $51,000.
鈥淐hoppy price action here with a lot of inside bar closes basically within the same intraday balance,鈥?he wrote.
鈥淥ften there鈥檚 a fakeout before the real expansive move.鈥?/blockquote>
Analyst eyes BTC dip if ETF inflows 鈥渄ry up鈥?/h2>
The U.S. spot-Bitcoin exchange-traded funds (ETFs) saw net inflows of nearly half a billion dollars on Feb. 15.
Related: Bitcoin bears beware 鈥?BTC鈥檚 rally above $52K is much healthier than before
This added to an impressive week in which the ETF products saw a 鈥渟econd wind鈥?鈥?an expansion of interest more than one month after their initial launch.
Despite removing much more BTC than that added to the supply per day, however, the ETFs are making some market observers nervous.
In his latest analysis, Venturefounder, a contributor at on-chain analytics platform CryptoQuant, suggested that a slowdown in ETF interest could leave Bitcoin susceptible to a major retracement.
鈥淏itcoin ETF net inflow flatline/normalize is where the next 20-30% correction will start,鈥?part of X commentary read alongside a summary of flows so far.
A previous post outlined potential BTC price floor levels, these extending all the way down to $34,000.
Possible scenarios if #Bitcoin ETF demand dries up in the next few weeks (by mid March 2024), and a correction does come:
Applying both 2021 #BTC local top fractals
First pump to $58k, then correction could stop at any of these levels: $52k, $47k, $42k, $38k, $34k (worst case) pic.twitter.com/OVmlTyJVr0
鈥?venturefound螢r (@venturefounder) February 16, 2024
This article does not contain investment advice or recommendations. Every investment and trading move involves risk, and readers should conduct their own research when making a decision.

Responses