Bitcoin’s muted price volatility shifts traders’ focus to LINK, ICP, RNDR and SUI

Bitcoin’s range bound price action has altcoin traders taking a closer look at LINK, ICP, RNDR and SUI.

Bitcoin (BTC) remains stuck in a range and is on target to end the week with a marginal gain of about 2%. Trading suite DecenTrader said in an update that the sideways price action could continue for one more month before a buying surge in anticipation of the halving in April.
While the spot Bitcoin exchange-traded funds (ETFs) have opened the gates for institutional investments, the inflows have been slow as large trading platforms are doing their due diligence, according to a Bloomberg report.

A minor positive in the short term is that Grayscale Bitcoin Trust’s (GBTC) outflows have been slowing down. BitMEX Research data shows that GBTC outflows have been hovering around the $200 million mark since Jan. 29, down from a high of $640 million on Jan. 22.
Bitcoin’s consolidation is a positive sign that may attract traders to select altcoins. Let’s look at the charts of the top 5 cryptocurrencies that may outperform in the near term.
Bitcoin price analysis
Bitcoin has stayed above the 20-day exponential moving average ($42,471) for the past few days, but the bulls have failed to challenge the overhead resistance at $44,700.

The weak rebound off the 20-day EMA suggests a lack of demand at higher levels. If the price turns down and breaks below $41,394, it will indicate that the BTC/USDT pair may consolidate between $44,700 and $37,980 for a few more days.
The $44,700 resistance is the key level to watch out for on the upside. A break and close above this level will signal that the bulls are back in control. That will clear the path for a potential rally to the psychologically crucial level of $50,000.

Both moving averages on the 4-hour chart have flattened out, and the RSI is near the midpoint, indicating equilibrium between buyers and sellers. A slide below the 50-simple moving average will tilt the advantage in favor of the sellers. The pair may then descend to $41,394.
If bulls want to seize control, they will have to shove the price above the $44,000 to $44,700 resistance zone. If they succeed, the pair could climb to $47,000. This level is likely to act as a solid obstacle, and the pair could dip to $44,700. If bulls flip this level into support, the pair may resume the uptrend and soar to $50,000.
Chainlink price analysis
Chainlink (LINK) surged above the overhead resistance of $17.32 on Feb. 2, signaling the resumption of the uptrend.

The 20-day EMA ($15.80) has started to turn up, and the RSI is near the overbought zone, indicating that the bulls are in the driver’s seat. There is a minor resistance at $19.54, but if crossed, the LINK/USDT pair could jump to the pattern target of $21.79.
If bears want to prevent the upside, they will have to pull the price back below the breakout level of $17.32. That will indicate aggressive selling at higher levels. The pair may then fall to the 20-day EMA.

The 4-hour chart shows that the bulls are trying to flip the $17.32 level into support. The rising moving averages and the RSI in the positive territory indicate that the bulls have the upper hand. A break and close above $18.88 will indicate the start of a new upward trend toward $21.38.
On the contrary, if the price turns down and breaks below $17.32, it will suggest that the bulls are losing their grip. The pair may drop to the 50-SMA and remain stuck inside a range for a while longer.
Internet Computer price analysis
Internet Computer (ICP) bounced off the 50-day SMA ($11.63) on Feb. 1, indicating that the bulls are vigorously guarding the level.

The long wick on the Feb. 3 candlestick shows that the bears are trying to halt the up move near $14, but a positive sign is that the bulls have not given up much ground. That increases the possibility of a break above $14. The ICP/USDT pair may then attempt a rally to $16.30.
This positive view will be invalidated in the near term if the price turns down and plummets below the 50-day SMA. The pair may later extend its drop to the breakout level of $9.36, where buyers are likely to step in.

The 4-hour chart shows that the pair is trading inside the range between $9.36 and $14. The pair bounced off the 20-EMA, indicating that lower levels are attracting buyers. The next stop on the upside is the stiff overhead resistance at $14.
If buyers overcome this barrier, the pair could rally to $16.30 and subsequently to the pattern target of $18.64. Alternatively, a slide below $11.20 will indicate that the pair may extend its stay inside the range for some more time.
Related: Bankrupt crypto lender Genesis seeks approval to sell $1.6B of trust assets
Render price analysis
Render (RNDR) broke above the $4.40 resistance on Jan. 30, and the bulls successfully held the pullback at the 50-day SMA ($4.26) on Jan. 31.

There is a minor resistance at $5.07, but it is likely to be crossed. The RNDR/USDT pair may then retest the high at $5.28. If buyers drive the price above this resistance, the pair could accelerate toward $6.60.
Alternatively, if the price turns down sharply from $5.28, it will indicate that the bears are active at higher levels. The pair may then again drop to the 50-day SMA. A break below this level will suggest that the up move is over in the short term. The pair may then slide to $4.

Both moving averages are sloping up, and the RSI is in the positive territory on the 4-hour chart, indicating that the short-term trend favors the buyers. The pair is likely to climb to $5.07 and then to $5.28.
The first sign of weakness will be a break and close below the 20-EMA. If that happens, the pair may drop to the breakout level of $4.40. This is an important level for the bulls to defend because a break below it may signal a short-term trend change.
Sui price analysis
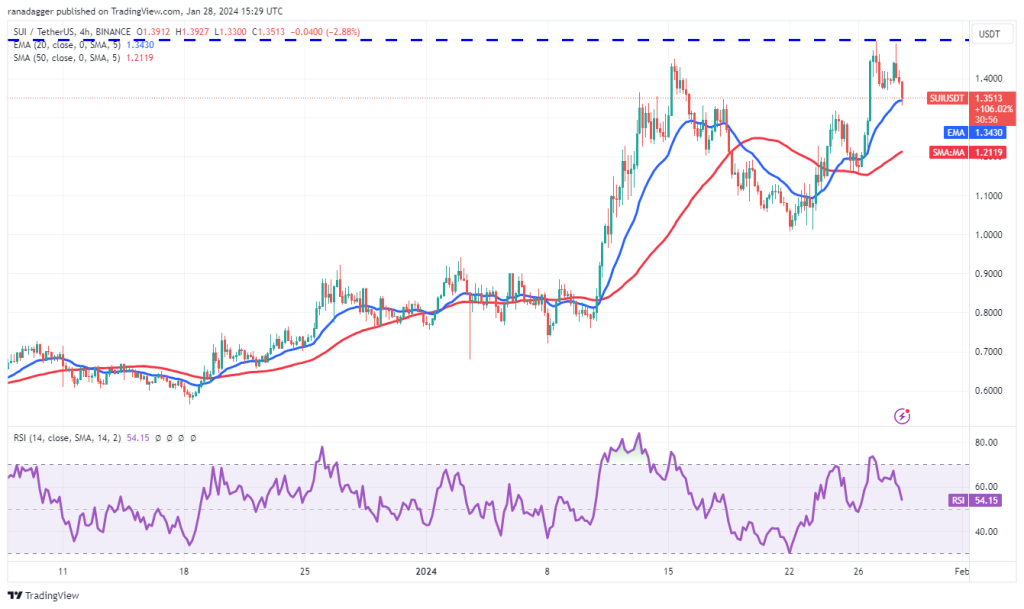
Sui (SUI) broke above the overhead resistance of $1.50 on Jan. 29, but the bulls could not sustain the breakout. That suggests a comeback attempt by the bears.

The SUI/USDT pair turned up from the 20-day EMA ($1.34), indicating that the sentiment remains positive and traders are viewing the dips as a buying opportunity.
Buyers will have to push the price above $1.65 to maintain the momentum. If they do that, the pair may ascend to $2. This level may again act as a significant hurdle, but if crossed, the rally could reach $2.64.
On the downside, the bears will have to yank the price below the 20-day EMA to gain the upper hand. The pair may then slump to the 50-day SMA ($1.04).

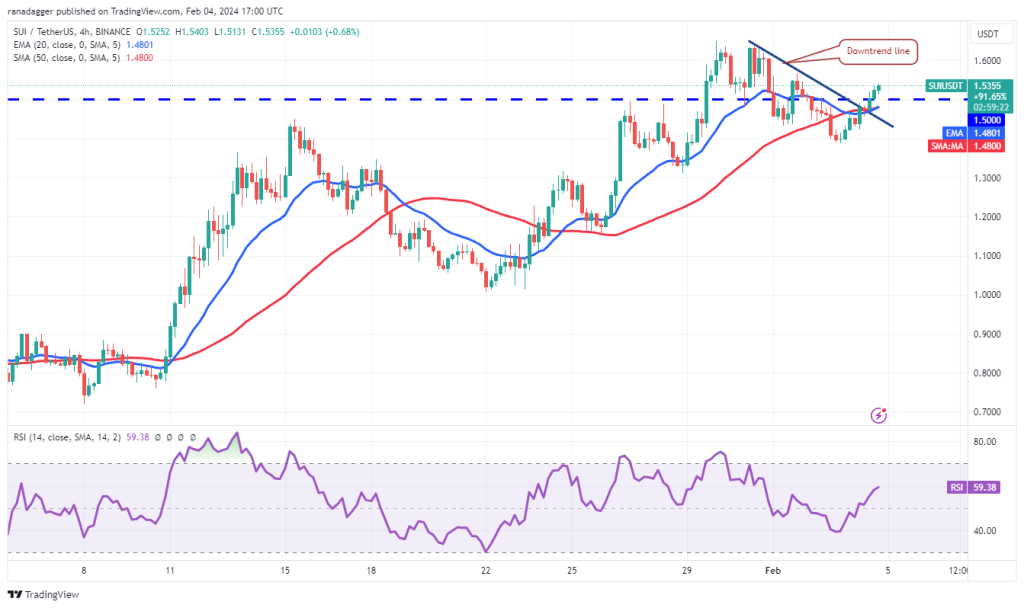
The bulls have pushed the price above the $1.50 level. If buyers maintain the breakout, the pair may travel to $1.57 and thereafter to $1.65. The bears will try to defend this level, but if the bulls prevail, the pair may start the next leg of the uptrend.
Contrary to this assumption, if the price turns down from the overhead resistance and breaks below 1.38, it will signal that the bears hold the edge. The pair could resume the correction toward $1.15 and then $1.


… [Trackback]
[…] Find More Info here to that Topic: x.superex.com/academys/markets/4100/ […]
… [Trackback]
[…] Find More to that Topic: x.superex.com/academys/markets/4100/ […]
… [Trackback]
[…] Read More Information here on that Topic: x.superex.com/academys/markets/4100/ […]
… [Trackback]
[…] Read More to that Topic: x.superex.com/academys/markets/4100/ […]
… [Trackback]
[…] Information to that Topic: x.superex.com/academys/markets/4100/ […]
… [Trackback]
[…] Read More Information here to that Topic: x.superex.com/academys/markets/4100/ […]
… [Trackback]
[…] Find More Information here on that Topic: x.superex.com/academys/markets/4100/ […]
… [Trackback]
[…] Read More Information here on that Topic: x.superex.com/academys/markets/4100/ […]
… [Trackback]
[…] Read More on that Topic: x.superex.com/academys/markets/4100/ […]
… [Trackback]
[…] Find More Information here on that Topic: x.superex.com/academys/markets/4100/ […]
… [Trackback]
[…] Read More Information here to that Topic: x.superex.com/academys/markets/4100/ […]
… [Trackback]
[…] There you can find 7634 additional Information on that Topic: x.superex.com/academys/markets/4100/ […]
… [Trackback]
[…] There you can find 91632 additional Information on that Topic: x.superex.com/academys/markets/4100/ […]
… [Trackback]
[…] Find More here to that Topic: x.superex.com/academys/markets/4100/ […]
… [Trackback]
[…] Information to that Topic: x.superex.com/academys/markets/4100/ […]