Cryptocurrency investment: The ultimate indicators for crypto trading


Cryptocurrency trading has gained a lot of traction in the past few years and has forged a niche of its own. Most investors hold Bitcoin and stake cryptocurrencies for long periods, hoping to see their investments grow without too much fuss. However, an increasing number of investors spend time and resources trying to make a living out of crypto trading.
There are valuable tools that help develop a trading strategy and a guide on how to invest in cryptocurrency. This article will look at the best indicators for crypto trading, the crypto signals and how indicators are used in crypto.
Learning how to keep emotions aside from the trading experience might be one of the main objectives of a thoughtful trader. However, knowing which tools are available and how to use them could improve a trader’s confidence and overall experience while helping to avoid some basic mistakes and grow an investment’s value.
Besides understanding markets from a macro-economic perspective and studying which projects are worth investing in, technical analysis for crypto is worth spending time on because it’s the tool that offers traders the chance to gain an advantage over others.
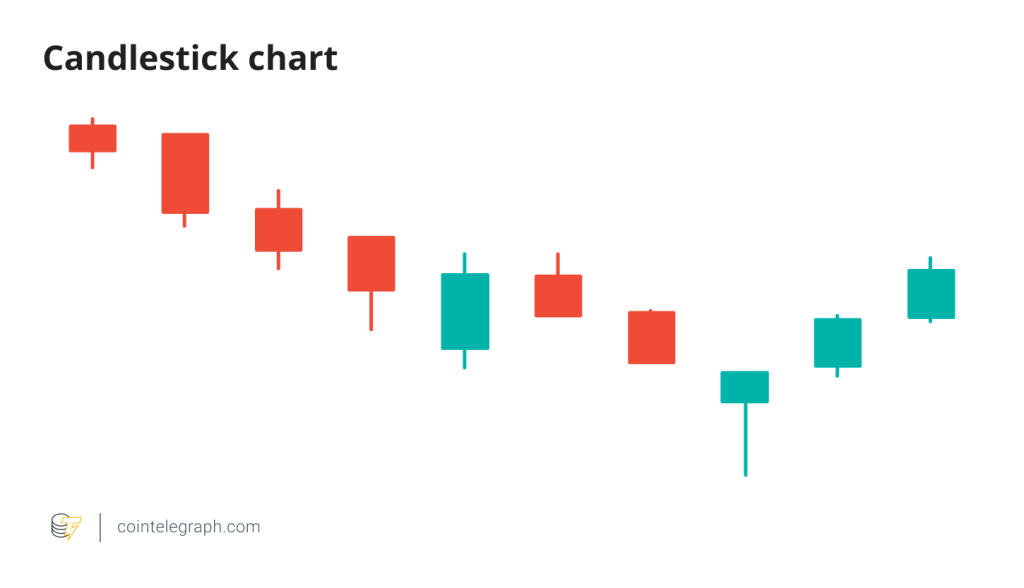
Technical analysis studies chart patterns, using indicators based on past price action data to predict future trends. Technical analysis involves mathematical calculations based on an asset’s price or volume, with the results used to predict future prices and can indicate a market trend or warnings that the trend is about to reverse.
No single indicator will detect a market reversal or confirm a market trend. The best strategy is to use a combination of indicators, or better, choose only a few of the available tools and combine them without too much chart cluttering, which might lead to more confusion than clarity.
The tools are available, and traders will personalize their experience choosing the ones that better fit their trading style. No specific indicators will offer better results than others; it’s mainly down to whether the trader feels more comfortable using one indicator over another.
This article will cover some of the most popular and utilized crypto research and investment tools available in the crypto space. However, this is by no means an exhaustive guide of resources available. With more experience, a trader can keep learning and understand the countless possibilities of other technical analysis tools.
What are good indicators for crypto?
Generally speaking, indicators are statistics that help us to understand current market conditions and future financial and economic trends. Technical indicators are used extensively in technical analysis to predict changes in a cryptocurrency’s trends or price patterns. Technical analysis observes a crypto's past trading activity and price changes to predict future price movements.
Technical analysis is different from fundamental analysis in that it focuses on a company's financials rather than historical price patterns or trends. Successfully selecting an indicator type depends entirely on the type of trading strategy an investor wants to apply, whether day, scalp or swing trading.
Common technical analysis indicators in traditional markets and cryptocurrency landscapes include moving averages, moving average convergence divergence (MACD) and the relative strength index (RSI).
Other indicators are more specific to the cryptocurrency markets: cryptocurrency social media indicators, crypto FOMO indicators, and the Fear and Greed Index in crypto.

Moving Average (MA)
Moving average technical indicators are among the most straightforward tools used in technical analysis. They are the average price of an asset over a specific period. They indicate an asset trending upwards in a positive (bullish) direction or moving downwards in a negative (bearish) direction.
They are also called lagging indicators because they follow the trend and provide delayed feedback after the price movement has already occurred. The most popular are the simple and the exponential moving averages, which are also the most common patterns used in crypto.
The simple moving average (SMA) captures trends that do not change direction quickly and therefore, are helpful to long-term traders. On the other hand, the exponential moving average (EMA) is better suited for short-term traders as it catches price changes quickly, giving more significance to recent price data.

The moving averages can be used for any timeframe. However, the most utilized are 200, 50, and 20-period moving averages; these allow traders to identify the general direction of the asset based on the chosen period dataset.
The 200-period SMA
The 200 SMA is the average closing price recorded over the past 200 days of a crypto asset, adding up the closing prices first and dividing the total by 200. It is for long-term traders who want to identify up or downtrends while also getting a great indication of support and resistance levels.
As a guideline, if the asset price is above the 200 moving average, the trend is up and bullish; if it’s below, the trend is down and bearish.
The 50-period SMA
Crypto technical traders tend to use this indicator a lot. It is helpful to identify support in uptrend markets and resistance in downtrend markets.
The 50-day moving average is the average price that investors have paid for a cryptocurrency over the past ten trading weeks (or two and a half months), and is typically regarded as a support level.
Death and Golden Crosses are recognized in the 200 and the 50-period SMA. If the 50 SMA is crossing the 200 SMA from up to down, it could be a Death Cross indication that a bear market is looming. In contrast, if the 50 SMA is crossing the 200 SMA from down to uptrend, that’s a Golden Cross that might indicate an approaching bullish market.
The 20-period SMA
The 20-period simple moving average is a shorter time frame more useful to day-traders. It calculates the average price of a crypto asset over the last 20 daily candles.
It allows traders to efficiently react faster to price changes in the market and trade breakouts because it manages to detect the low of the buildup before the actual breakout. Although, it’s also possible that such short-term movements represent false alarms like bull or bear traps.
MACD
The moving average convergence divergence indicator (or oscillator) is a good buying or selling simple momentum indicator and one of the most popular tools used by crypto traders.
The MACD divergence refers to the two underlying moving averages moving apart, while the convergence relates to the two underlying moving averages coming towards each other.
What does this mean, and how is the MACD indicator used?
It is considered to be a trend-following momentum indicator, meaning that it will give indications on both a trend and the momentum (the tendency for rising asset prices to increase further and falling prices to keep falling.) It is designed to reveal changes in the strength, direction, momentum and duration of a trend in a cryptocurrency’s price.

The MACD indicator is the difference between a short period and a longer period of exponential moving averages. Typically, the 12 and the 26-period EMAs are considered in crypto. The result of those calculations is the MACD line, which can offer interesting buy or sell signals.
If the MACD is above 0, it is positive and indicates an upside (bullish) momentum, meaning that it is a good time to buy. If it is below 0, it is negative and shows a downside (bearish) momentum, meaning that it is a good time to sell.
By looking at the MACD chart, traders can also understand how strong the current trend is. For example, if the chart shows higher highs, but the MACD shows lower highs, there is a good chance that the markets could go on a downtrend soon because the price is increasing, but the momentum is decreasing.
The MACD and the RSI are generally used together since they measure momentum through different factors.
RSI
The MACD and the RSI are valuable tools with which technical traders can analyze an asset’s price charts, looking for patterns indicating when to buy or sell the crypto.
The relative strength indicator is another technical analysis momentum indicator that evaluates a cryptocurrency's weakness or strength through recent price changes to spot the overbought or oversold conditions of an asset. The indicator is also suitable for spotting a divergence and warning traders of a possible trend reversal.
The RSI is most typically used on a 14-day timeframe and is measured on a scale from 0 to 100, with high and low levels marked at 70% and 30%, respectively. Generally, levels below 30 are considered oversold, and levels above 70 are assumed to be overbought with respective signals to buy or sell. Also, when the RSI goes below the 70% level, this can be interpreted as a bearish signal; on the other hand, if it rises above 30%, this can be seen as a bullish sign.
Short-term traders may use a 5- or 7-period RSI, while long-term investors may opt for 21- or even 30-period RSI.
Bollinger Bands
Bollinger bands are a technical indicator for the price and volatility of a crypto asset over time and take their name from John Bollinger, the technical trader who developed them. They consist of three main components: the simple moving average (usually the 20-period SMA), an upper band, and a lower band, usually two standard deviations away from the SMA. A standard deviation calculates the difference between a group of values or prices from the average value/price.
For instance, If prices are in a narrow trading range (short-term consolidation), the standard deviation will return a low value that indicates low volatility, thus making it a good indicator of volatility. The upper Bollinger band is the positive standard deviation. This area shows the underlying price is growing unusually, and it’s a good indication that it might be overbought.
The lower Bollinger band represents the negative standard deviation. This area shows the underlying price is shrinking unusually, and it’s a good indication that it might be oversold. As the bands expand, the indication is that the market is becoming more volatile as prices move away from the lagging 20 MA. As bands contract, the market might become less volatile.
Do technical indicators work for crypto?
In traditional markets, traders can reasonably rely on technical analysis tools, such as the ones highlighted here, to forecast an asset's future price movement based on past market data.
However, the cryptocurrency market is still a relatively young asset class with little history of past market data, making forecasts more challenging to assess. Moreover, the high volatility of the crypto market has often invalidated attempts to forecast future movements correctly.
Some indicators work better for crypto’s volatility, though. For instance, the On-Balance-Volume (OBV) is a relatively credible momentum indicator to forecast breakout directions in price. It can also help track down money flow from institutional investors or prominent market players. It studies the accumulated trading volume of a cryptocurrency over the previous days, weeks, and even months. It measures the crypto buying and selling pressure.
An increasing OBV means more buyers are willing to purchase the asset at the trading price, and it’s a good indicator of price momentum picking up. A decreasing OBV means selling pressure is high, and it is often seen near the all-time highs, giving traders the chance to sell to make profits. This usually marks a bearish sentiment getting started in the market.
Cryptocurrency social media indicators
Other types of indicators are considered in the crypto space, especially in the era of millennials' intense social media interaction and online marketing strategies that have worked well alongside the cryptocurrency framework.
These indicators turn out to be particularly useful with smaller market capitalization cryptocurrencies, which may experience greater price movements if a popular influencer or celebrity mentions or openly promotes the project.
Outside of the traditional metrics like price and trade volume, it’s become necessary to understand how the new generation of traders communicate market sentiment. Social media activity and search traffic can offer a great indication of prices rising or falling.
Google trends are one of the most popular and reliable tools used to track cryptocurrency social buzz and assess search volumes. An increasing number of platforms provide social analytics aggregating data directly from popular cryptocurrency sources like Reddit and Twitter.
Two significant indicators for the cryptocurrency market are the Crypto FOMO indicator and the Fear and Greed Index in crypto.
Emotions, especially fear and greed, are strong drivers of cryptocurrency market behavior.
The Fear and Greed Index provides sentiment analysis and can be used as a FOMO indicator. The popular buy low and sell high trading strategy doesn’t always apply in crypto.
What often occurs is that when FOMO is exceptionally high in the crypto market, and especially when the market is rising, people get greedy (shown as extreme greed in the index), which leads to the fear of missing out on an opportunity. This causes prices to go up, and it’s usually a good signal for selling an asset.
In contrast, traders worrying about possible trend reverses is indicated as extreme fear in the Fear and Greed Index, the fear of a loss that could have been prevented. The delay in selling an asset could lead to more considerable losses and more damage. The result is that traders race to sell the asset, causing prices to fall further.
Worth a mention is the Bitcoin dominance and the Bitcoin hash rate indicators.
Bitcoin dominance
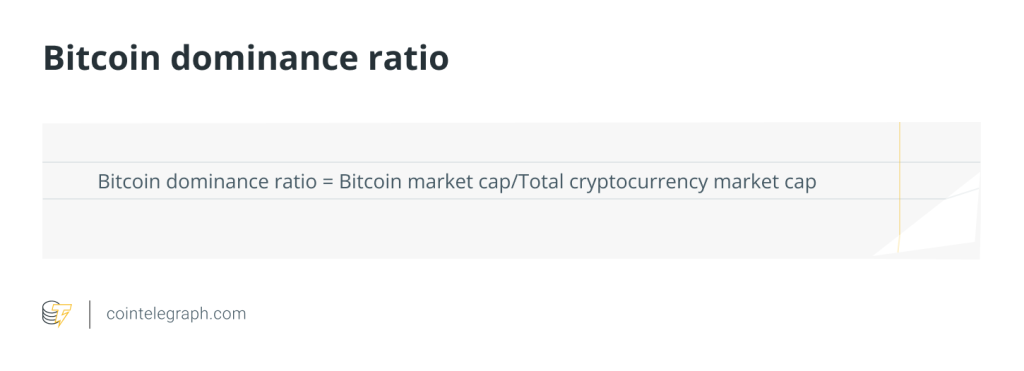
The ratio of the market capitalization of Bitcoin to the total market capitalization of Bitcoin is known as Bitcoin dominance. A cryptocurrency's market capitalization is a measurement of its market value.

Bitcoin dominance influences the whole market as most of the smaller cap coins follow Bitcoin price movements. It measures Bitcoin’s market cap in relation to the rest of the market. If the total market cap of the whole market is growing and Bitcoin dominance is going down, an “alt season” (the bull market for altcoins) is likely approaching.
Bitcoin hash rate
Although it cannot be considered an accurate indicator as such, the Bitcoin hash rate is a great metric to assess the health of the Bitcoin network. The hash rate is the amount of computing power that BTC miners generate to create new blocks and process new transactions.
The hash rate of Bitcoin is measured in hashes per second (h/s). Because Bitcoin's network is huge and powerful, it can process quintillions of hashes per second. A quintillion is the same as a million million millions, or 1,000,000,000,000,000,000.
It has shown some correlation with the price in the past because it represents a guarantee that the network is secure at any point in time and the investor can rely on it. However, it should not be regarded as a precise indicator in relation to price predictions.


… [Trackback]
[…] Find More Information here on that Topic: x.superex.com/academys/beginner/3250/ […]
… [Trackback]
[…] Read More on on that Topic: x.superex.com/academys/beginner/3250/ […]
… [Trackback]
[…] Information to that Topic: x.superex.com/academys/beginner/3250/ […]
… [Trackback]
[…] Read More on to that Topic: x.superex.com/academys/beginner/3250/ […]
… [Trackback]
[…] Read More Information here to that Topic: x.superex.com/academys/beginner/3250/ […]
… [Trackback]
[…] Find More Information here on that Topic: x.superex.com/academys/beginner/3250/ […]
… [Trackback]
[…] Find More on that Topic: x.superex.com/academys/beginner/3250/ […]
… [Trackback]
[…] Find More Information here on that Topic: x.superex.com/academys/beginner/3250/ […]
… [Trackback]
[…] Info to that Topic: x.superex.com/academys/beginner/3250/ […]
… [Trackback]
[…] Find More here to that Topic: x.superex.com/academys/beginner/3250/ […]
… [Trackback]
[…] Find More here on that Topic: x.superex.com/academys/beginner/3250/ […]
… [Trackback]
[…] There you will find 62790 more Information to that Topic: x.superex.com/academys/beginner/3250/ […]
… [Trackback]
[…] Find More on to that Topic: x.superex.com/academys/beginner/3250/ […]
… [Trackback]
[…] Find More Information here on that Topic: x.superex.com/academys/beginner/3250/ […]
… [Trackback]
[…] Information to that Topic: x.superex.com/academys/beginner/3250/ […]
… [Trackback]
[…] Read More on that Topic: x.superex.com/academys/beginner/3250/ […]
… [Trackback]
[…] Here you will find 97283 additional Info on that Topic: x.superex.com/academys/beginner/3250/ […]
… [Trackback]
[…] Read More here to that Topic: x.superex.com/academys/beginner/3250/ […]
… [Trackback]
[…] Info on that Topic: x.superex.com/academys/beginner/3250/ […]
… [Trackback]
[…] Information to that Topic: x.superex.com/academys/beginner/3250/ […]
… [Trackback]
[…] Find More on on that Topic: x.superex.com/academys/beginner/3250/ […]
… [Trackback]
[…] Find More to that Topic: x.superex.com/academys/beginner/3250/ […]
… [Trackback]
[…] Read More to that Topic: x.superex.com/academys/beginner/3250/ […]
… [Trackback]
[…] Information to that Topic: x.superex.com/academys/beginner/3250/ […]
… [Trackback]
[…] Read More Info here to that Topic: x.superex.com/academys/beginner/3250/ […]
… [Trackback]
[…] Here you can find 69451 more Info to that Topic: x.superex.com/academys/beginner/3250/ […]
… [Trackback]
[…] There you can find 74553 more Info on that Topic: x.superex.com/academys/beginner/3250/ […]
… [Trackback]
[…] Read More to that Topic: x.superex.com/academys/beginner/3250/ […]
… [Trackback]
[…] Find More Information here to that Topic: x.superex.com/academys/beginner/3250/ […]