What are supply and demand zones, and how do we use them in crypto trading
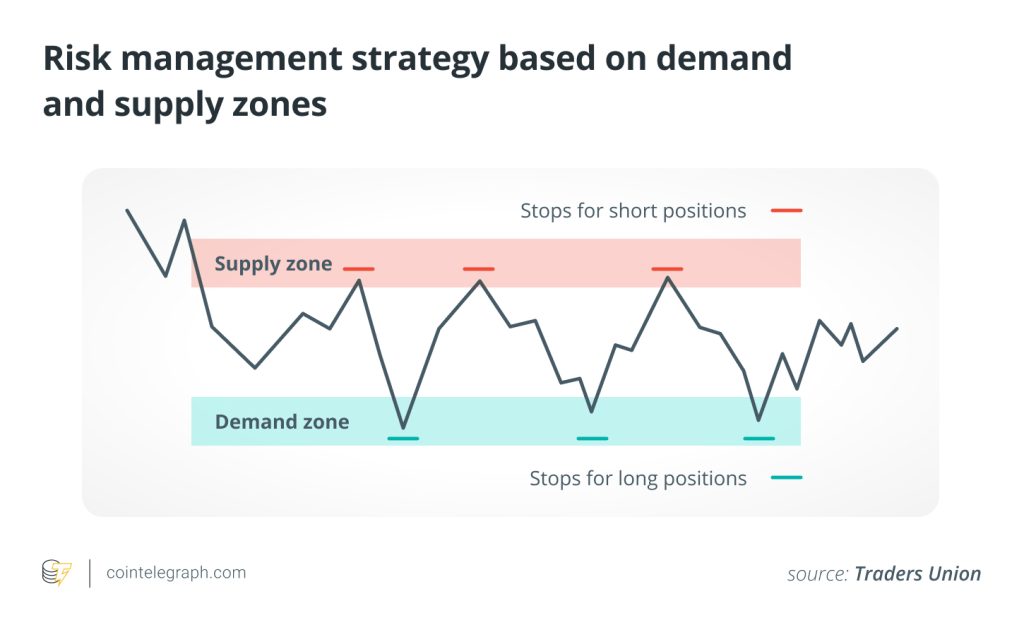
Discover how identifying supply and demand zones can provide valuable insights, aiding traders in making informed decisions.

Identifying supply and demand zones is an essential part of technical analysis that can help traders optimize their activities. These zones are consolidation areas that can occur before a significant upward or downward price movement.
Supply and demand zones can indicate areas of market reversal or trend continuation, and crypto traders leverage them in attempts to turn a profit from their crypto trading strategies. This article digs into what supply and demand zones in crypto trading are, the types of supply and demand zones, and how crypto traders find these technical indicators.
What is supply and demand in crypto trading?
Supply and demand influence cryptocurrency prices. In trading, supply is the number and activity of sellers, whereas demand is the number and activity of buyers.
An influx of buyers usually drives up prices, while a surge in sellers tends to push prices lower. Supply-and-demand cryptocurrency trading strategies aim to exploit periods of excess supply or excess demand. Cryptocurrency traders want to buy when prices are low (excess supply) and sell when prices are high (excess demand).
What are supply and demand zones?
A supply zone is where the supply of a cryptocurrency exceeds the demand; there is excess supply; the price is falling; and a price chart will show a downtrend. On the other hand, a demand zone is where the demand for a cryptocurrency exceeds the supply; demand is high; the price is rising; and a price chart will show an uptrend.
In crypto trading, crypto whales or institutional investors often lead to high levels of activity. These zones are resistance levels that confirm a trend. They are not quite as simple to spot as a quick dip or rise in price, but there are patterns to look for. The following sections explain in depth how supply and demand zones can be more accurately identified.
Impulse waves
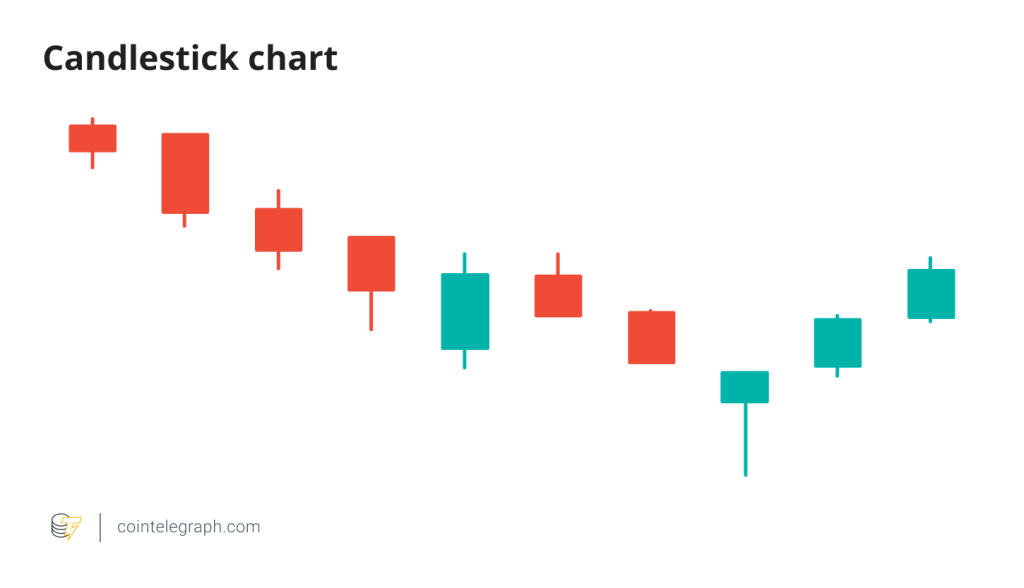
Impulse waves, represented by large green or red candles on a price chart used for technical analysis, can indicate supply and demand zones. An upward impulse wave (high demand) will see large green upswing candles. An impulse wave downward (high supply) will see large red downswing candles.
An impulse wave can show a market leaving a supply or demand zone and an imbalance between buy and sell orders that could be the start of a new trend.
Activity in a supply zone
A supply zone, indicated by large red downswing candles, indicates a downtrend, which could be a bearish reversal from a previous upswing or the continuation of a downtrend. As the downswing continues, prices will decline. Traders may try to profit from “shorting” in this market.
Activity in a demand zone
A demand zone, indicated by large green upswing candles, shows an upward trend that could be a bullish reversal or, again, the continuation of a trend. During the upswing, a crypto’s price will rise, and traders may look to take a “long” position in the cryptocurrency.
Types of supply and demand zones
There are vital differences between bearish or bullish reversals and the continuation of existing trends that will have implications for investors. Chart patterns may reveal these different types of supply and demand zones.
Reversal patterns
Reversal patterns show prices leaving an upward trend and entering a downward trend, or vice versa.
Drop base rally (bullish)
A price will move downward, then remain around a price for some time, creating a base structure, before rallying upward (high demand).
Rally base drop (bearish)
A price will move upward, then create a base, before dropping downward (high supply).

Continuation patterns
Continuation patterns show when a price tries to break through a pattern, forming a base, but then the existing trend continues. These are weaker patterns with less momentum than reversal patterns and are usually less favorable for investors.
Drop base drop
The price drops, pauses the downward trend to create a base, and continues the solid downward trend.
Rally base rally
The price rises and pauses its upward trend, creating a base, but then the solid upward trend continues.

How to find supply and demand zones
Market shifts, or imbalances between supply and demand, create supply and demand zones. Larger candles, known as explosive price candles or extended range candles (ERCs), are a clearer sign of market imbalance. These candles usually have longer bodies with small wicks. Two types of ERCs that indicate demand and supply zones are:
- Green ERCs: indicate strong market demand and rising prices (demand zone)
- Red ERCs: indicate strong market supply and falling prices (supply zone).
Supply zones are indicated by large red downswing candles (ERCs) with short wicks on a price chart. A strong supply zone may see a pause in the downward trend before the trend persists, with more large candles appearing. A demand zone sees a similar trend, but upward, with large red upswing candles.
Support and resistance levels
Experienced cryptocurrency traders may look for several technical analysis indicators of changing prices and supply and demand, as well as supply and demand zones.
Pivot points, or resistance and support levels, are one such indicator. Support is where the price in a downward trend stops due to increased demand. A resistance level is where an upward price trend reverses and there is a sell-off of a cryptocurrency. Another indicator, Fibonacci levels, helps to identify turning points in supply and demand zones.
How crypto traders use supply and demand zones
Using supply and demand zones effectively requires an in-depth understanding of trading strategies and knowledge of technical analysis. As cryptocurrency traders build their knowledge, they can distinctly identify supply and demand zones, mark them on a price chart, and discover support, resistance and Fibonacci levels.
With knowledge, traders will adopt a strategy that suits their risk tolerance. A range-trading strategy may involve taking a long or short position. A breakout strategy will see a trader look to take a position in favorable conditions, hoping to have bought at the start of a long-term upward trend.

Risks of supply and demand cryptocurrency trading strategies
Trading in supply and demand zones does carry a few specific risks in addition to the usual crypto trading and investment pitfalls to watch out for. They include:
False breakouts
A price may break through a supply or demand zone and suddenly reverse direction. Such a scenario can often result from market manipulation or low trading volume.
News and market sentiment
Supply and demand zone trading strategies use technical analysis to make decisions and ignore fundamental analysis. News of an economic or market event and anything that suddenly shifts market sentiment will render analysis of supply and demand zones useless.
Reliance on supply and demand zones
Supply and demand zone trading is a valuable tool for investors, but it’s best used combined with other technical analysis, fundamental analysis and other strategies. At the very least, investors use other indicators to confirm market moves that seem to be apparent in supply and demand zones.
Risk management is the key to protecting against losses
Crypto traders may try to profit from shorting a supply zone or taking a long position in a demand zone. In essence, they will sell when demand is strong and the price is high and buy when supply is strong and the price is low, taking advantage of price changes to turn a profit.
Managing risk requires meticulous stop-loss orders across all trading situations. This includes protecting both long and short positions, ensuring safe entry points for breakout buys in specific strategies, and mitigating potential losses in swing trading.
Moreover, successful cryptocurrency trading requires in-depth knowledge of how to identify supply and demand zones accurately, a full understanding of technical analysis, and the many strategies and indicators experienced traders utilize.
This article does not contain investment advice or recommendations. Every investment and trading move involves risk, and readers should conduct their own research when making a decision.



… [Trackback]
[…] Read More Information here on that Topic: x.superex.com/news/bitcoin/3136/ […]
… [Trackback]
[…] Find More on that Topic: x.superex.com/news/bitcoin/3136/ […]
… [Trackback]
[…] Read More to that Topic: x.superex.com/news/bitcoin/3136/ […]
… [Trackback]
[…] Here you will find 29549 more Information on that Topic: x.superex.com/news/bitcoin/3136/ […]
… [Trackback]
[…] Information on that Topic: x.superex.com/news/bitcoin/3136/ […]
… [Trackback]
[…] Read More on that Topic: x.superex.com/news/bitcoin/3136/ […]
… [Trackback]
[…] Find More on that Topic: x.superex.com/news/bitcoin/3136/ […]
… [Trackback]
[…] Find More Info here to that Topic: x.superex.com/news/bitcoin/3136/ […]
… [Trackback]
[…] Information on that Topic: x.superex.com/news/bitcoin/3136/ […]
… [Trackback]
[…] Find More Info here to that Topic: x.superex.com/news/bitcoin/3136/ […]
… [Trackback]
[…] Here you can find 73752 additional Information to that Topic: x.superex.com/news/bitcoin/3136/ […]
… [Trackback]
[…] Read More to that Topic: x.superex.com/news/bitcoin/3136/ […]
… [Trackback]
[…] There you can find 99323 additional Info on that Topic: x.superex.com/news/bitcoin/3136/ […]
… [Trackback]
[…] Here you can find 57324 more Info to that Topic: x.superex.com/news/bitcoin/3136/ […]
… [Trackback]
[…] Read More on on that Topic: x.superex.com/news/bitcoin/3136/ […]
… [Trackback]
[…] Find More Information here on that Topic: x.superex.com/news/bitcoin/3136/ […]
… [Trackback]
[…] Read More to that Topic: x.superex.com/news/bitcoin/3136/ […]
… [Trackback]
[…] Read More Info here to that Topic: x.superex.com/news/bitcoin/3136/ […]
… [Trackback]
[…] Info to that Topic: x.superex.com/news/bitcoin/3136/ […]
… [Trackback]
[…] Find More here on that Topic: x.superex.com/news/bitcoin/3136/ […]
… [Trackback]
[…] Find More here to that Topic: x.superex.com/news/bitcoin/3136/ […]
… [Trackback]
[…] There you can find 35490 additional Information on that Topic: x.superex.com/news/bitcoin/3136/ […]
… [Trackback]
[…] Read More to that Topic: x.superex.com/news/bitcoin/3136/ […]
… [Trackback]
[…] Information on that Topic: x.superex.com/news/bitcoin/3136/ […]
… [Trackback]
[…] Find More Information here on that Topic: x.superex.com/news/bitcoin/3136/ […]
… [Trackback]
[…] Info to that Topic: x.superex.com/news/bitcoin/3136/ […]