What are pivot points, and how does pivot trading work?


Pivot points are key price levels used in technical analysis to identify potential support and resistance areas, helping traders decide on entering or exiting trades based on price action around the pivot points. This article will explain the role of pivot points in trading, how to calculate them, and various pivot point strategies.
What is a pivot point?
A pivot point is a technical indicator used in trading that helps traders determine probable support and resistance points in a given financial market. It is designed to identify possible price levels where a market trend could reverse or suffer a substantial price movement.
It is calculated using the previous day’s high, low and close prices. Traders use pivot points to determine entry and exit positions, as well as to assess the general market sentiment and future price targets.
Support is a price level where it is anticipated that purchasing pressure will be sufficient to stop further price decreases. In contrast, resistance is a price level where it is anticipated that selling pressure will be sufficient to stop further price increases. Pivot points are used to identify these levels.
The terms “high price” and “low price” describe the highest and lowest prices, respectively, at which an asset is traded during a specific time period. The asset’s closing price is the final price at which it traded during that time.
Professional traders frequently incorporate pivot points into their trading strategies. They provide crucial reference points for locating probable market support and resistance levels. Due to their capacity to draw attention to intraday price levels and potential reversals, pivot points are particularly useful to traders who engage in trading strategies, including day trading, swing trading and intraday trading.
The role of pivot points in trading
By supporting traders in spotting market patterns, forecasting price reversals, and identifying locations of support and resistance, pivot points play a significant role in trading.
Pivot points aid traders in comprehending the general market movement. Traders can determine whether prices are primarily heading upward (bullish) or downward (bearish) by drawing pivot points on a price chart. They can adjust their trading methods accordingly by taking positions in the direction of the trend or watching for potential trend reversals.
Pivot points serve as key levels of support and resistance. Prices approaching a pivot point can be a psychological roadblock affecting market sentiment. Traders closely watch these levels as prospective locations where prices may turn around or consolidate. A pivot point breakout or rebound can offer important clues about the direction and strength of the market.
Finally, pivot point breaks and bounces significantly impact one’s trade. Prices may signal a change in momentum and the start of a new trend if they strongly break above a pivot point. In contrast, if prices bounce off a pivot point rather than breaking it, it might support the current trend or indicate a future trend reversal.
Related: Active vs. new addresses in crypto: Key differences explained
Different types of pivot points
In trading analysis, pivot points can take many different forms. These pivot points give traders different viewpoints on support and resistance levels, enabling them to make better trading decisions based on their preferred approach. Some of the most common types are explained below:
Standard pivot points
These fundamental pivot points are calculated using the high, low and close prices from the day before. Based on the average price, they indicate levels of support and resistance. Consider a crypto trader who wants to determine the usual pivot points for Bitcoin (BTC) based on the previous day’s high, low and close prices.

The pivot point at $59,166.67 might be used by traders as a benchmark for the future trading day. Price movement below the pivot point denotes a bearish market, while price movement above the pivot point denotes positive sentiment.
The S1 and S2 levels indicate potential places where the price may find support or buying interest. These levels may serve as potential entry targets for long positions or locations for stop-loss orders for traders. The R1 and R2 levels point to potential regions of selling pressure or resistance to the price. Traders may see these levels as prospective spots to close out their long holdings or as places to start their short positions.
Fibonacci pivot points
Fibonacci ratios are taken into account when calculating Fibonacci pivot points. These pivot points are created by adding or subtracting Fibonacci ratios from the pivot point and multiplying the trading range by those numbers.
Assuming that the high, low, and close prices of BTC are $500, $400 and $480, respectively, the Fibonacci pivot points for BTC would be:

The support levels (S1: $421.8, S2: $398.2) provide potential buying opportunities, while the pivot point ($460) serves as a reference level. The resistance levels (R1: $498.2, R2: $521.8), on the other hand, allude to possible selling points. Traders can use these levels to decide on entry, exit and anticipated price moves in BTC trading.
Camarilla pivot points
To determine support and resistance levels, Camarilla pivot points employ a different formula that takes into account the preceding day’s high, low and close prices. These pivot points are primarily for intraday trading.
Here is an example of how to calculate Camarilla pivot points for BTC by assuming the below values:

These levels can help traders identify potential support and resistance zones for BTC trading based on the Camarilla pivot points.
Woodie’s pivot points
A technical analysis method called Woodie’s pivot points is used in the financial markets to pinpoint probable support and resistance levels. Woodie’s pivot points give the closing price more consideration than other pivot point calculations. It employs a special formula that emphasizes the closing price of the previous period but is similar to standard pivot point computations in other ways.
Compared with typical pivot points, this can lead to various levels of support and resistance, which might provide traders with distinct perspectives on the state of the market. To aid their decision-making, traders can use Woodie’s pivot points to pinpoint prospective price levels where the market might run into support or resistance.

On the basis of the pivot point, Woodie’s support and resistance levels are then determined. The formula for calculating support levels (S1, S2, S3) and resistance levels (R1, R2, R3) varies and involves specific calculations based on the pivot point value.
Tom DeMark’s pivot points
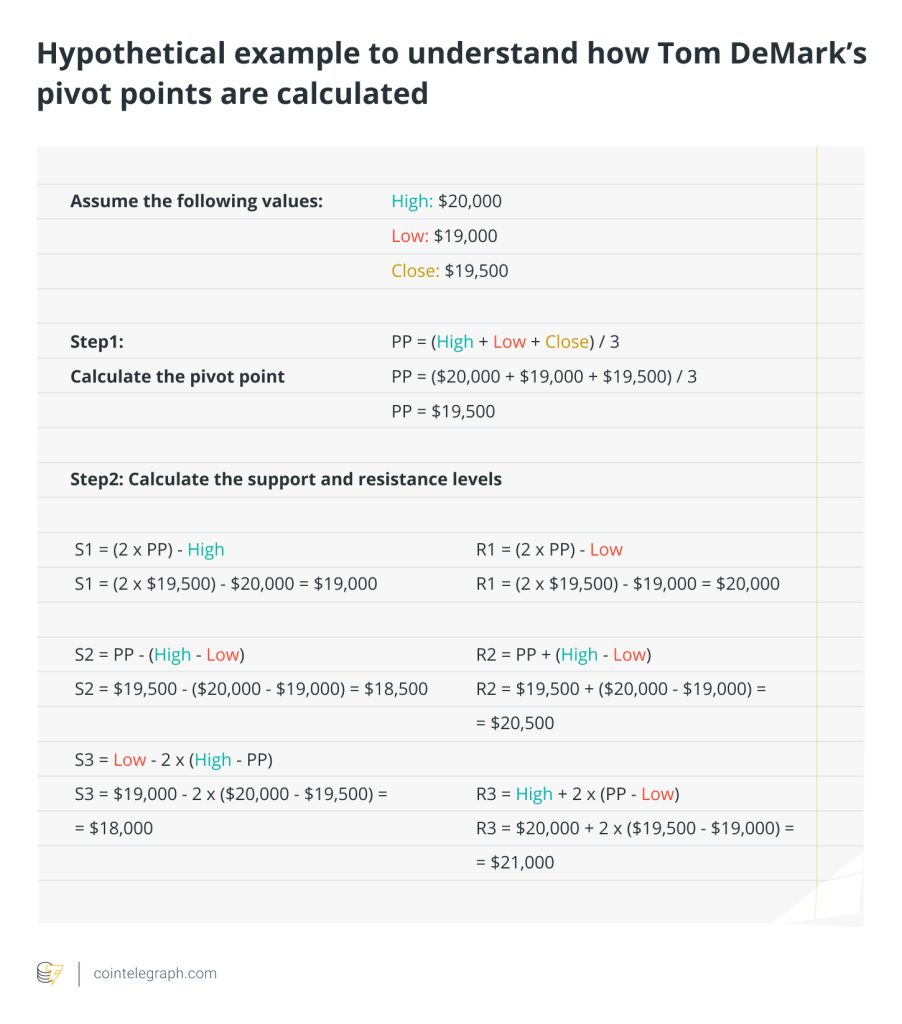
Tom DeMark’s pivot points are frequently used in technical analysis. They assist in locating crucial levels of support and resistance, enabling traders to make defensible choices based on probable price changes. Here’s an example of how to calculate Tom DeMark’s pivot points for cryptocurrencies using the following data:

Pivot trading strategies
To profit from price changes based on pivot points, traders frequently employ pivot trading tactics. Some common trading strategies are discussed below:
Pivot breakout strategy
The pivot breakout technique involves entering a trade when a price breaks above or below a critical pivot level, signaling a potential trend continuation or reversal. Traders wait for a clear breakout before entering a trade in that direction. For instance, a cryptocurrency may indicate bullish momentum if it breaks above a resistance pivot level. Traders may open a long position, anticipating the price to rise further.
Pivot bounce strategy
Trading price reversals at pivot levels is the main objective of the pivot bounce technique. Traders look for price bounces off pivot points that have generated regions of support or resistance. A cryptocurrency price approaching a pivot level of support and then rising again can provide a buying opportunity. On the other hand, if the price hits a pivot level of resistance and then declines, it can be a good time to sell.
Pivot range strategy
Trading within the range established by the pivot points is part of the pivot range approach. The range between the pivot points for support and resistance is identified by traders, who then search for chances to purchase close to support and sell close to resistance. If a cryptocurrency’s price frequently fluctuates between a set of pivot points on the crypto market, traders can place trades whenever the price exceeds the range’s predetermined upper and lower bounds.
Related: The most common crypto metrics: A beginner's guide
Implementing pivot points in trading
Putting pivot points into practice entails using them as a crucial instrument to help with decision-making. To increase the dependability of trading signals, pivot points are frequently combined with other technical indicators, such as moving averages. By adding an additional layer of analysis to their decision-making process, this combination assists traders in validating prospective entry and exit positions.
Pivot points are frequently used in trading strategies by traders who are fans of price action. Price movements near pivot points, such as breakouts or bounces, can reveal important information about the mood and movement of the market. Traders can make trading decisions based on the concepts of price action analysis by keeping an eye on how the price behaves in relation to these levels.
Creating efficient trading methods is crucial when applying pivot points. Traders should clearly define trading strategies based on pivot levels and other supporting indicators. Implementation success depends on dedication and consistency.
However, it is important to remember that several variables affect how reliable pivot points are in trading. Their effectiveness is influenced by the state of the markets, the precision of the pivot calculation technique, and their aptitude for effectively interpreting price action patterns. Traders should do in-depth backtesting and analysis to assess the effectiveness of pivot points in their trading systems.
Along with technical factors, trading psychology plays a crucial role. Emotions can influence judgment, resulting in impulsive or unreasonable trading actions. Traders must cultivate sound trading psychology, which includes self-control, endurance and the capacity to adhere to predetermined trading plans.
How reliable are pivot points in trading?
There are a number of variables that can affect how reliable pivot points are in trading. Although traders frequently employ pivot points for insightful information about market dynamics, it’s crucial to recognize their limitations and consider other factors for a thorough analysis.
In markets with obvious trends and defined support and resistance levels, pivot points have proven reliable. They can serve as a reference point for locating possible entry and exit levels, and regions of price consolidation or reversal. Due to their capacity to draw attention to intraday price levels and potential reversals, pivot points are frequently particularly helpful to traders who engage in day trading or intraday trading.
However, market circumstances might impact how reliable pivot points are. Pivot points may offer less trustworthy signals when there is low volatility or irregular price movement. It’s important to consider the context in which pivot points are utilized and adjust the application of pivot points to the present market climate.
Traders frequently combine pivot points with other technical indicators or price movement analyzes to increase their dependability. The validity of trading signals obtained from pivot levels is strengthened by confirmation from several indicators or patterns. Moving averages, trendlines or oscillators are a few additional tools that can be used to augment the study and increase its overall accuracy.
When assessing the reliability of pivot points, extensive backtesting and analysis are also crucial. Historical data can be employed to model trades based on pivot points and gauge their performance over time. To make wise judgments based on the data, traders need to understand the usefulness of pivot points within the market and the period they have selected.
Although pivot points can be a useful trading tool, no indicator offers a 100% accuracy guarantee. Investors should approach pivot points critically, always consider other pertinent elements, efficiently manage risk and create a thorough trading plan. Maximizing the dependability and efficacy of pivot points in trading requires a combination of the talents, knowledge, and experience of individual traders.
Written by: Jagjit Singh


… [Trackback]
[…] There you will find 16247 additional Info on that Topic: x.superex.com/academys/beginner/3110/ […]
… [Trackback]
[…] Here you can find 91351 more Information on that Topic: x.superex.com/academys/beginner/3110/ […]
… [Trackback]
[…] Read More here to that Topic: x.superex.com/academys/beginner/3110/ […]
… [Trackback]
[…] Find More Info here on that Topic: x.superex.com/academys/beginner/3110/ […]
… [Trackback]
[…] Find More on on that Topic: x.superex.com/academys/beginner/3110/ […]
… [Trackback]
[…] Read More on that Topic: x.superex.com/academys/beginner/3110/ […]
… [Trackback]
[…] Read More Info here to that Topic: x.superex.com/academys/beginner/3110/ […]
… [Trackback]
[…] There you will find 31797 additional Information to that Topic: x.superex.com/academys/beginner/3110/ […]
… [Trackback]
[…] Information on that Topic: x.superex.com/academys/beginner/3110/ […]
… [Trackback]
[…] Read More Information here to that Topic: x.superex.com/academys/beginner/3110/ […]
… [Trackback]
[…] Read More here to that Topic: x.superex.com/academys/beginner/3110/ […]
… [Trackback]
[…] Read More on that Topic: x.superex.com/academys/beginner/3110/ […]
… [Trackback]
[…] There you can find 19123 more Info to that Topic: x.superex.com/academys/beginner/3110/ […]
… [Trackback]
[…] Here you will find 95652 more Info on that Topic: x.superex.com/academys/beginner/3110/ […]
… [Trackback]
[…] Information to that Topic: x.superex.com/academys/beginner/3110/ […]
… [Trackback]
[…] Read More on that Topic: x.superex.com/academys/beginner/3110/ […]
… [Trackback]
[…] Read More on that Topic: x.superex.com/academys/beginner/3110/ […]
… [Trackback]
[…] Find More Info here on that Topic: x.superex.com/academys/beginner/3110/ […]