Why is Bitcoin price down today?

Bitcoin price is down today as traders begin to realize profits following the debut of spot BTC ETFs.

Bitcoin dropped to its current price of $43,306 on Jan. 12, one day after spot Bitcoin exchange-traded funds (ETFs) began trading on stock exchanges.
The bullish momentum that propelled Bitcoin (BTC) toward $49,000 on Jan. 11 seems to have waned on Jan. 12, with Bitcoin trading 5% lower than the day’s opening at $43,954.

The market’s excitement over the approval of spot Bitcoin ETFs by the United States Securities and Exchange Commission seems to be cooling down.
Let’s take a closer look at the factors impacting Bitcoin price today.
Are large investors staying away from spot ETF trading?
Investors are still digesting the debut of spot Bitcoin ETFs trading as institutions wait a few days before deploying their capital.
Large accounts with substantial capital at their disposal tend to act with caution and precision. They are likely to avoid the initial frenzy of a new financial product’s launch, instead choosing to wait for the market to stabilize before committing significant funds.

Therefore, while some may feel Bitcoin did not respond to the launch of spot ETF trading with the bullishness they expected, the current correction could be a period of adjustment that will be followed by massive moves upward as capital begins to flow in.
According to Yahoo Finance data, the second day of spot Bitcoin ETF trading has seen trading volume surpass $1 billion. This brings the cumulative volume of spot Bitcoin ETFs clear of $5 billion.
BlackRock’s iShares Bitcoin Trust (IBIT) opened the session on the second day at $25.27, recording 9.5% losses over the previous 24 hours. IBIT’s volume was $11.3 million at the time of writing.

The Grayscale Bitcoin Trust (GBTC) traded 5.5% down, and the Valkyrie Bitcoin Trust (BRRR) traded 10% down over the same period, handling $27.8 million and $112,980 volume, respectively.
Bitcoin long liquidations ramp up
A sharp movement in the Bitcoin futures market appears to have been a reason for the swiftness of today’s price decline. The timing of the long liquidations coincided with the sharp drop in the price of the pioneer cryptocurrency.
Bitcoin long liquidations quickly spiked to $12.52 million in a span of one hour on Jan. 12.

Typically, long liquidations occur when there is a sudden drop in the price of the asset that is being traded. This is because traders who were bullish on the asset and had opened long positions on the same will now face losses since the market has moved against them.
According to data from blockchain data and intelligence platform Glassnode, the number of Bitcoin transferred to exchanges spiked on Jan. 10.

Increased exchange inflows for a particular asset suggest increased selling pressure in the market.
. @glassnode is reporting a $500M #Bitcoin inflow into @coinbase. https://t.co/HSQPykMQOG pic.twitter.com/EDfRmzFV8W
— James Van Straten (@jimmyvs24) January 12, 2024
A record number of BTC wallet addresses are in profit
More data from Glassnode suggests the number of Bitcoin wallets currently in profit has reached a record high at $46.8 million.

With a record number of wallets in profit, investors seem to be booking profits at current prices. The decline in trading volume combined with the high number of investors realizing profit may explain the current downturn in price.
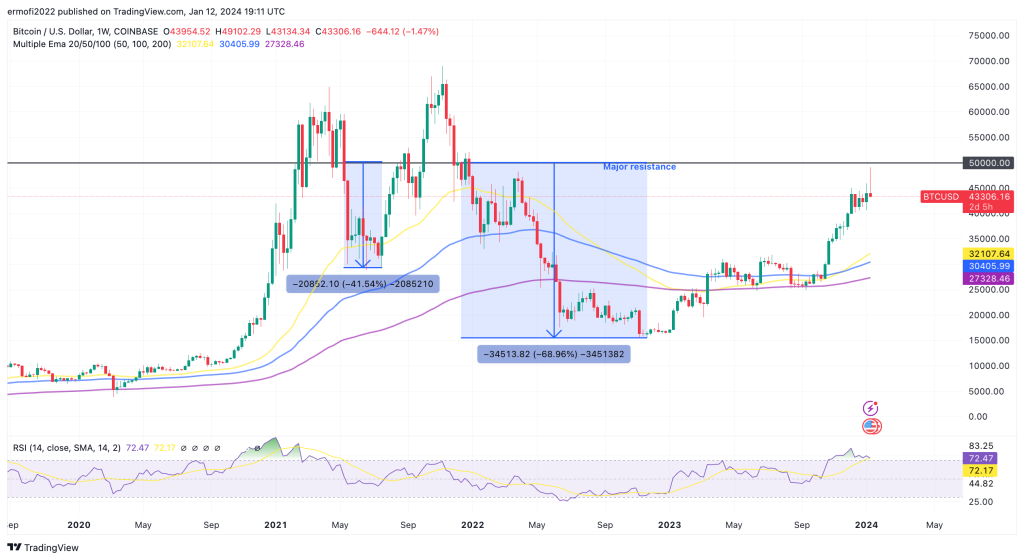
Bitcoin still faces stiff resistance at $50,000
BTC’s sudden rise toward $49,000 on Jan. 11 was short-lived, with the price correcting quickly toward $46,000. This could be attributed to the stiff resistance around the $50,000 supplier congestion zone.
Note that the first time the BTC price dropped below this level was in May 2021, when it shed more than 41% of its value. The second time was after a failed attempt to reclaim this level in March 2022 when the selling pressure sank the price more than 77% to seek solace from the $15,000 support wall.
As such, Bitcoin bulls have to push the price back above $45,000 and try to flip the $50,000 psychological level into support in order to secure the uptrend.

The position of the weekly relative strength index in the overbought region suggests BTC is still due for further upside in the medium to long term.
Key levels to watch on the downside are the $41,200 support level and the demand zone around $40,000.


… [Trackback]
[…] Read More on to that Topic: x.superex.com/news/bitcoin/2459/ […]
… [Trackback]
[…] Read More here to that Topic: x.superex.com/news/bitcoin/2459/ […]
… [Trackback]
[…] Information to that Topic: x.superex.com/news/bitcoin/2459/ […]
… [Trackback]
[…] Find More Info here on that Topic: x.superex.com/news/bitcoin/2459/ […]
… [Trackback]
[…] There you can find 54791 additional Information on that Topic: x.superex.com/news/bitcoin/2459/ […]
… [Trackback]
[…] Find More on on that Topic: x.superex.com/news/bitcoin/2459/ […]
… [Trackback]
[…] There you can find 23601 more Information on that Topic: x.superex.com/news/bitcoin/2459/ […]
… [Trackback]
[…] Read More on on that Topic: x.superex.com/news/bitcoin/2459/ […]
… [Trackback]
[…] Read More on to that Topic: x.superex.com/news/bitcoin/2459/ […]
… [Trackback]
[…] There you will find 4347 more Info to that Topic: x.superex.com/news/bitcoin/2459/ […]
… [Trackback]
[…] Info on that Topic: x.superex.com/news/bitcoin/2459/ […]
… [Trackback]
[…] Read More Info here on that Topic: x.superex.com/news/bitcoin/2459/ […]
… [Trackback]
[…] Find More on that Topic: x.superex.com/news/bitcoin/2459/ […]
… [Trackback]
[…] There you will find 56936 more Information to that Topic: x.superex.com/news/bitcoin/2459/ […]
… [Trackback]
[…] Find More on that Topic: x.superex.com/news/bitcoin/2459/ […]
… [Trackback]
[…] Find More Info here on that Topic: x.superex.com/news/bitcoin/2459/ […]
… [Trackback]
[…] Here you will find 92659 more Info to that Topic: x.superex.com/news/bitcoin/2459/ […]
… [Trackback]
[…] Information to that Topic: x.superex.com/news/bitcoin/2459/ […]
… [Trackback]
[…] Read More here to that Topic: x.superex.com/news/bitcoin/2459/ […]
… [Trackback]
[…] Find More Info here to that Topic: x.superex.com/news/bitcoin/2459/ […]
… [Trackback]
[…] Here you will find 68179 additional Information to that Topic: x.superex.com/news/bitcoin/2459/ […]
… [Trackback]
[…] Read More Information here on that Topic: x.superex.com/news/bitcoin/2459/ […]
… [Trackback]
[…] Information on that Topic: x.superex.com/news/bitcoin/2459/ […]
… [Trackback]
[…] There you can find 65835 additional Information to that Topic: x.superex.com/news/bitcoin/2459/ […]
… [Trackback]
[…] Find More Info here to that Topic: x.superex.com/news/bitcoin/2459/ […]
… [Trackback]
[…] Read More here on that Topic: x.superex.com/news/bitcoin/2459/ […]
… [Trackback]
[…] Find More to that Topic: x.superex.com/news/bitcoin/2459/ […]
… [Trackback]
[…] Information to that Topic: x.superex.com/news/bitcoin/2459/ […]
… [Trackback]
[…] Info to that Topic: x.superex.com/news/bitcoin/2459/ […]
… [Trackback]
[…] Find More to that Topic: x.superex.com/news/bitcoin/2459/ […]
… [Trackback]
[…] Find More on on that Topic: x.superex.com/news/bitcoin/2459/ […]
… [Trackback]
[…] Read More to that Topic: x.superex.com/news/bitcoin/2459/ […]
… [Trackback]
[…] Find More to that Topic: x.superex.com/news/bitcoin/2459/ […]
… [Trackback]
[…] Information to that Topic: x.superex.com/news/bitcoin/2459/ […]
… [Trackback]
[…] Read More here on that Topic: x.superex.com/news/bitcoin/2459/ […]
… [Trackback]
[…] There you can find 45075 more Information on that Topic: x.superex.com/news/bitcoin/2459/ […]
… [Trackback]
[…] Read More here on that Topic: x.superex.com/news/bitcoin/2459/ […]
… [Trackback]
[…] Information to that Topic: x.superex.com/news/bitcoin/2459/ […]
… [Trackback]
[…] Information to that Topic: x.superex.com/news/bitcoin/2459/ […]
… [Trackback]
[…] Find More Info here to that Topic: x.superex.com/news/bitcoin/2459/ […]
… [Trackback]
[…] There you can find 44966 more Info on that Topic: x.superex.com/news/bitcoin/2459/ […]
… [Trackback]
[…] Read More Info here on that Topic: x.superex.com/news/bitcoin/2459/ […]
… [Trackback]
[…] Find More Info here on that Topic: x.superex.com/news/bitcoin/2459/ […]
… [Trackback]
[…] Find More on to that Topic: x.superex.com/news/bitcoin/2459/ […]
… [Trackback]
[…] Find More here to that Topic: x.superex.com/news/bitcoin/2459/ […]
… [Trackback]
[…] Find More on that Topic: x.superex.com/news/bitcoin/2459/ […]
… [Trackback]
[…] Find More on that Topic: x.superex.com/news/bitcoin/2459/ […]
… [Trackback]
[…] Read More on on that Topic: x.superex.com/news/bitcoin/2459/ […]
… [Trackback]
[…] Info to that Topic: x.superex.com/news/bitcoin/2459/ […]
… [Trackback]
[…] Read More Information here on that Topic: x.superex.com/news/bitcoin/2459/ […]