What are the indicators associated with Bitcoin halving?

In our previous article, we examined the effects of Bitcoin's once-every-four-year halving on different aspects of the ecosystem and discussed its chain effect. This article aims to delve deeper into related theoretical hypotheses and explore data indicators associated with the halving event. Historically, these indicators can help predict the peaks and bottoms of the Bitcoin market.
Bitcoin halving effect and economic activity theory model
In our previous article, we pointed out that mining serves two crucial roles in the Bitcoin network: validating transactions and creating new Bitcoins. On the one hand, transaction verification within the Bitcoin network reflects a range of transactional activities, resembling the diverse economic transactions observed in the real world. The only distinction lies in the payment method and settlement currency. On the other hand, the issuance of new Bitcoins can be likened to the conventional practice of "printing money". Essentially, the halving of Bitcoin block rewards is an adjustment made to Bitcoin's deflationary monetary policy, and it has far-reaching impacts on every aspect of the Bitcoin ecosystem. Assuming stable transaction activity within the Bitcoin network, a decrease in the circulation of Bitcoin can have a long-term cumulative effect, stimulating a rise in its price. However, once its price reaches a certain level, the Bitcoin economy may overheat, leading to a subsequent decline in price. When transaction activity keeps decreasing, the market will enter an undervalued state. The creation of the NVT Ratio indicator, to some extent, is derived from this economic phenomenon.
The NVT Ratio is defined as Bitcoin market value (or Bitcoin's total market cap) divided by the total transaction volume in the specified window. (NVT Ratio = Bitcoin Market Cap/Transactin Volume) The fundamental concept behind the NVT Ratio is that Bitcoin's market value should correspond to its on-chain transaction activity. A high NVT Ratio, which signifies a relatively higher market value in relation to transaction activity, could indicate an overheated market and potentially an inflated price. On the contrary, a low NVT Ratio, indicating a relatively lower market value compared to transaction activity, may suggest an undervalued market and potentially a price that is too low.

Figure 1: NVT Ratio (Source: https://charts.woobull.com/)
Introduction to NVT Ratio: https://woobull.com/introducing-nvt-ratio-bitcoins-pe-ratio-use-
it-to-detect-bubbles/
Bitcoin halving and the scarcity theory
The total supply of Bitcoin is limited, and every four years, the block rewards are halved. This leads to a gradual decrease in the total number of newly generated Bitcoins each year. This continuous reduction further enhances Bitcoin's scarcity, akin to gold. In fact, many people in the cryptocurrency market often refer to Bitcoin as "digital gold." PlanB, an analyst believes that scarcity is a main driver for Bitcoin in value. Based on the economic concept of the stock-to-flow ratio, he proposed the Stock-to-Flow Ratio (S2F) indicator to quantify the scarcity of Bitcoin.
S2F: According to PlanB's model, he utilizes the current stock of Bitcoin and the annual production rate to calculate the Stock-to-Flow Ratio. This ratio is subsequently compared to the market price of Bitcoin. He argues that there is a correlation between the Stock-to-Flow Ratio and the price of Bitcoin. A higher Stock-to-Flow Ratio indicates a potential increase in price, while a lower Stock-to-Flow Ratio suggests a possible decline in price.

Figure 2: S2F Model (Source: glassnode)
Reference documents relate to the S2F mode:
https://medium.com/@100trillionUSD/modeling-bitcoins-value-with-scarcity-91fa0fc03e25
Theory of Bitcoin miner sell pressure
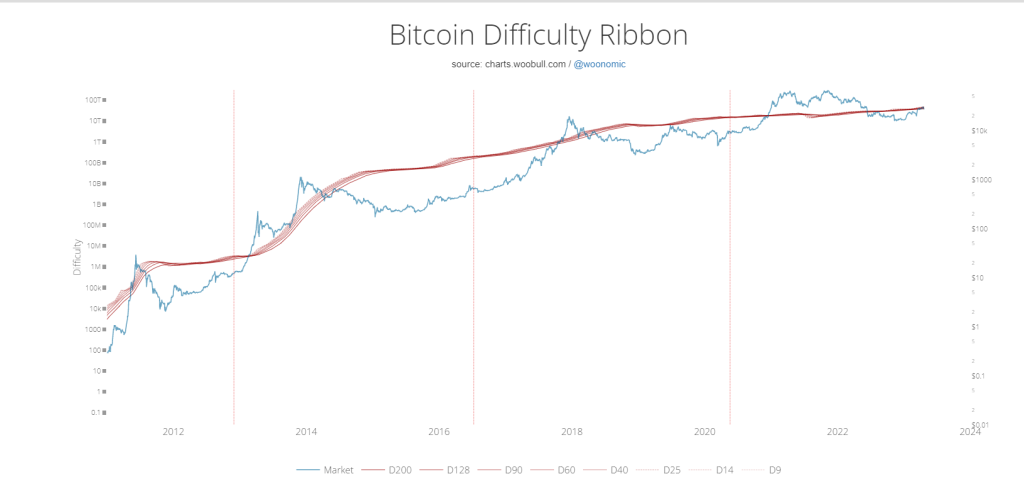
A theory has been proposed based on the behavior of miners, the important participants in the Bitcoin network. According to this theory, a sustained increase in the price of Bitcoin attracts many miners to participate in mining, resulting in a significant surge in computing power. As the mining difficulty increases, Bitcoin's production cost rises continuously, similar to the concept of rapid capacity expansion in traditional industries. Conversely, when the price of Bitcoin goes down, smaller miners may stop mining due to high costs, leading to a decrease in mining difficulty and ultimately bringing the cost of Bitcoin production back to a reasonable level. As mentioned in our previous article, the historical total mining cost of PoW can be used as a reference to assess the overall valuation of Bitcoin. It provides an objective "real value level" that is independent of individual confidence or subjective ideas. By offering a solid value reference, it helps mitigate extreme price swings. As a result, the price of Bitcoin is less prone to abrupt crashes overnight or skyrocketing surges in a day. The Bitcoin Difficulty Ribbon indicator is built on this theory, and it has proven to be more effective in predicting the price bottom compared to other indicators.
BTC Difficulty Ribbon: The BTC Difficulty Ribbon is an indicator that tracks changes in the Bitcoin mining difficulty. It is composed of several moving averages of the difficulty. The BTC Difficulty Ribbon indicator describes the impact of miner selling pressure on Bitcoin's price dynamics. As the growth rate of the Bitcoin difficulty slows down, some miners may exit the market, leaving only those with stronger capabilities to continue operating without needing to sell off large amounts of Bitcoin. This can lead to a contraction of the Difficulty Ribbon, which is usually a good time to buy Bitcoin.

Figure 3: BTC Difficulty Ribbon (Source: https://charts.woobull.com/)
Introduction to BTC Difficulty Ribbon: https://woobull.com/introducing-the-difficulty-ribbon-
the-best-times-to-buy-bitcoin/
A summary of Bitcoin halving indicators
Due to the abundance of Bitcoin halving indicators available, this article will not provide a comprehensive analysis of each one. Instead, we will list several indicators that are commonly used to predict Bitcoin's price peaks and bottoms for your reference.
HOLD Waves: HODL Waves provides a visual representation of the distribution of Bitcoin supply based on the
duration of stagnation. It is a tool to analyze the behavior of long-term holders and assess the potential impact of the
halving cycle on their activity.
Supply Distribution: Glassnode offers data on the distribution of Bitcoin supply across various wallet size categories,
including large holders, small holders, and exchanges. This data can be utilized to gain insights into the behavior and accumulation patterns of different market participants during halving events.
Puell Multiple: The Puell Multiple is calculated by dividing the daily output value of Bitcoin by the 90-day average output value. When the Puell Multiple falls below a specific threshold, it indicates that the Bitcoin market may be
entering an undervalued phase, which could signal a potential increase in price.
MVRV Ratio: It represents the ratio between the Bitcoin market cap and its realized value. The realized value refers to the cost basis of purchasing Bitcoin. When the MVRV Ratio exceeds a certain threshold, it may indicate that the
Bitcoin market is overheated and at risk of experiencing a price correction.
NVT Signal: The NVT Signal is calculated by comparing the NVT Ratio with its moving average. When the NVT Signal drops below a predetermined threshold, it indicates that the Bitcoin price may be nearing a bottom, potentially
signaling a reversal or an increase in price.
Unrealized Profit/Loss: This indicator showcases the unrealized profits and losses of Bitcoin holders. In other words, it refers to the difference between the current value of the Bitcoin held by investors and the price at which they bought it. When the unrealized profits and losses dip into negative territory, it may indicate that the market is approaching a bottom or an oversold state, potentially presenting an opportunity for a price reversal.


… [Trackback]
[…] Read More on on that Topic: x.superex.com/academys/deeplearning/1983/ […]
… [Trackback]
[…] Find More Info here to that Topic: x.superex.com/academys/deeplearning/1983/ […]
… [Trackback]
[…] Find More here to that Topic: x.superex.com/academys/deeplearning/1983/ […]
… [Trackback]
[…] Find More on that Topic: x.superex.com/academys/deeplearning/1983/ […]
… [Trackback]
[…] Read More to that Topic: x.superex.com/academys/deeplearning/1983/ […]
… [Trackback]
[…] Find More Info here on that Topic: x.superex.com/academys/deeplearning/1983/ […]
… [Trackback]
[…] Information to that Topic: x.superex.com/academys/deeplearning/1983/ […]
… [Trackback]
[…] Read More to that Topic: x.superex.com/academys/deeplearning/1983/ […]
… [Trackback]
[…] Find More Info here on that Topic: x.superex.com/academys/deeplearning/1983/ […]
… [Trackback]
[…] Read More Info here on that Topic: x.superex.com/academys/deeplearning/1983/ […]
… [Trackback]
[…] There you will find 28600 more Information on that Topic: x.superex.com/academys/deeplearning/1983/ […]
… [Trackback]
[…] Information to that Topic: x.superex.com/academys/deeplearning/1983/ […]
… [Trackback]
[…] Find More here to that Topic: x.superex.com/academys/deeplearning/1983/ […]
… [Trackback]
[…] Find More Information here to that Topic: x.superex.com/academys/deeplearning/1983/ […]
… [Trackback]
[…] Information on that Topic: x.superex.com/academys/deeplearning/1983/ […]
… [Trackback]
[…] Information to that Topic: x.superex.com/academys/deeplearning/1983/ […]
… [Trackback]
[…] Read More Information here on that Topic: x.superex.com/academys/deeplearning/1983/ […]
… [Trackback]
[…] Find More Information here on that Topic: x.superex.com/academys/deeplearning/1983/ […]
… [Trackback]
[…] Information to that Topic: x.superex.com/academys/deeplearning/1983/ […]
… [Trackback]
[…] Info on that Topic: x.superex.com/academys/deeplearning/1983/ […]
… [Trackback]
[…] Read More to that Topic: x.superex.com/academys/deeplearning/1983/ […]
… [Trackback]
[…] Information to that Topic: x.superex.com/academys/deeplearning/1983/ […]
… [Trackback]
[…] Read More Information here to that Topic: x.superex.com/academys/deeplearning/1983/ […]
… [Trackback]
[…] Find More on to that Topic: x.superex.com/academys/deeplearning/1983/ […]
… [Trackback]
[…] Read More Info here to that Topic: x.superex.com/academys/deeplearning/1983/ […]
… [Trackback]
[…] Find More to that Topic: x.superex.com/academys/deeplearning/1983/ […]
… [Trackback]
[…] Find More Info here to that Topic: x.superex.com/academys/deeplearning/1983/ […]
… [Trackback]
[…] Find More here to that Topic: x.superex.com/academys/deeplearning/1983/ […]
… [Trackback]
[…] Info on that Topic: x.superex.com/academys/deeplearning/1983/ […]