
How Can Everyday Users Use Spot Grid Trading to Optimize Their Returns(II)

#SuperEx #SpotGrid #TradingStrategy
In the previous article, we explained which market conditions are suitable for spot grid trading, how to select a trading pair, and why grid profit is different from total profit.
Understanding how a grid works, however, is only the first step.
The result of a grid strategy depends on whether its price range, grid count, capital allocation, and exit conditions work together. During the same market movement, one strategy may repeatedly buy low and sell high, while another may accumulate trading costs and unrealized losses because its range is too narrow, its grids are too dense, or its capital is distributed poorly.
Part II therefore moves beyond the definition of grid trading and addresses a more practical question: How should everyday users design, monitor, and adjust a complete SuperEx Spot Grid strategy?

A Grid Manages Inventory, Not Just Trading Frequency
Many users evaluate a grid strategy only by the number of completed trades.
Trading frequency, however, is not the final objective.
A spot grid simultaneously manages two assets:
- The quote asset, such as USDT;
- The base asset, such as BTC, ETH, or another token.
When the price falls, the strategy uses USDT to purchase the base asset. When the price rises, it sells the base asset back into USDT.
Every grid execution therefore changes the composition of the account:
- During a decline, base-asset holdings increase while USDT decreases;
- During a rally, base-asset holdings decrease while USDT increases;
- During repeated fluctuations, the strategy continuously converts between the two assets.
Before creating a grid, users should therefore ask more than how frequently it may trade:
- How much of the base asset could I hold if price reaches the lower boundary?
- How much of it could remain if price reaches the upper boundary?
- Am I comfortable with this change in portfolio composition?
- If price leaves the range, do I want to keep holding or exit completely?
A grid is first an inventory-management path and only then an automated execution tool.
Four Parameters Must Be Designed as One System
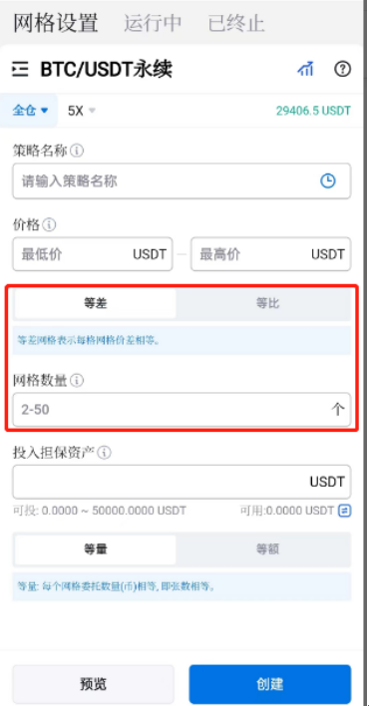
The core parameters of a manually created SuperEx Spot Grid include:
- The lower price;
- The upper price;
- The number of grids;
- The investment amount.
These are not four independent numbers.
The price range determines how much market movement the strategy covers. The grid count determines the distance between adjacent orders, while the investment amount determines how much capital can be allocated to each grid.
For example, with the same 1,000 USDT investment:
- A narrower range with more grids may trade more frequently but earn less per grid;
- A wider range with fewer grids may earn a larger spread per trade but execute less often;
- Too many grids may make each order too small to satisfy minimum-order requirements;
- Too few grids may fail to capture ordinary price movements.
A more structured sequence is:
- Decide how long the strategy is expected to run;
- Define a reasonable price range for that period;
- Select the grid interval based on asset volatility;
- Calculate the expected net return after trading costs;
- Confirm that the investment can support all planned orders;
- Determine the final number of grids.
Users should not begin with an arbitrary grid count and force the other parameters to fit around it.
How to Set an Effective Price Range
A price range is not simply a prediction of the highest and lowest prices. It defines the area within which the user is willing to keep the strategy active.
An effective range should:
- Cover normal asset volatility;
- Exclude market conditions that would invalidate the strategy;
- Match the intended operating period.
1. Define the Strategy Duration
For a strategy expected to run for three to seven days, users may examine recent hourly or four-hour market structure.
For a strategy intended to run for several weeks or months, higher-timeframe support, resistance, and historical trading ranges become more relevant.
An excessively wide range may leave many short-term orders inactive. An excessively narrow long-term range may fail during ordinary market volatility.
2. Avoid Placing Boundaries Directly on Support and Resistance
Price may temporarily move through support or resistance before returning to the range. If the boundary is placed directly on these levels, an ordinary wick may move the market outside the active grid.
A practical approach is to leave some room beyond the main support and resistance areas.
However, a larger buffer is not always better. A range that is too wide may reduce capital efficiency, so the asset’s normal volatility must still be considered.
3. Avoid Creating a Grid Too Close to a Boundary
If the current price is already close to the upper boundary, there will be fewer sell orders above and more buy orders below. A decline may cause the grid to accumulate the base asset quickly.
If the current price is close to the lower boundary, the system will generally require more of the base asset for the sell orders above. A continued rally may reduce the user’s base-asset holdings relatively quickly.
For a neutral range strategy, creating the grid with price near the middle of the selected range generally produces a more balanced order structure.
4. Give the Lower Boundary a Clear Invalidation Meaning
Users should answer: At what price would I stop treating this movement as normal volatility and conclude that the market structure has changed?
That level should guide the stop-loss or strategy reassessment.
Without an invalidation condition, the lower boundary is often just a price the user hopes the market will not cross.
Use a Formula to Select Grid Count
Suppose a user creates the following arithmetic grid:
- Lower boundary: 80 USDT;
- Upper boundary: 120 USDT;
- Number of grids: 20.
The absolute interval between adjacent levels is: (120–80) ÷ 20 = 2 USDT
The levels would therefore be approximately 80, 82, 84, and so on up to 120 USDT.
However, a fixed 2 USDT interval produces different percentage returns at different prices:
- An increase from 80 to 82 is approximately 2.5%;
- An increase from 100 to 102 is approximately 2%;
- An increase from 118 to 120 is approximately 1.69%.
This is the defining feature of an arithmetic grid: the absolute price difference is constant, but the percentage return decreases as the price rises.
A geometric grid maintains a constant percentage between adjacent levels. The approximate interval can be calculated as: Grid ratio = (Upper boundary ÷ Lower boundary)^(1 ÷ Number of grids) — 1
Using the same 80–120 USDT range:
- With 20 grids, the interval is approximately 2.05%;
- With 40 grids, the interval is approximately 1.02%.
Doubling the grid count may create more trading opportunities, but it approximately halves the gross return available per grid.
Users must also deduct:
- The buying fee;
- The selling fee;
- Market slippage;
- Execution costs caused by wider spreads;
- Potential selling costs when terminating the strategy.
The relevant calculation is therefore: Net grid return = Gross grid return — Round-trip trading fees — Slippage and execution costs
SuperEx’s official notes suggest that beginners may use a single-grid return of around 1% as a starting reference. The final setting should still reflect live fees, liquidity, and asset volatility. SuperEx Spot Grid Notes
Investment Amount Determines Whether the Grid Can Operate Properly
Capital invested in a grid does not remain as one static position. It is distributed across multiple buy and sell orders.
If the investment is too small relative to the grid count, the strategy may face:
- An order amount that is too small for each grid;
- Failure to satisfy the trading pair’s minimum-order requirement;
- Inability to create certain orders;
- Failure to place replacement orders after an upward adjustment;
- Trading costs consuming too much of the return.
For example, with the same 500 USDT investment:
- Dividing it across 10 grids leaves a relatively meaningful amount per order;
- Dividing it across 50 grids substantially reduces the amount available to each order;
- If the trading pair has a higher minimum-order requirement, some orders may fail.
Users should therefore confirm the minimum order size before selecting the number of grids.
The amount allocated to a grid should also not represent all available capital. A more balanced structure may include:
- Capital for the active grid;
- Reserve funds for future strategy adjustments;
- Long-term holdings;
- Funds that do not participate in trading.
The reserve is not intended for endless averaging down. Its purpose is to preserve the user’s ability to make a new decision after the market structure changes.
How Should AI Parameters Be Used?
SuperEx supports both manual and AI-created spot grids. AI parameters use historical data, including 7-day, 30-day, and 180-day periods, together with algorithmic analysis to generate reference strategies. Introduction to SuperEx Spot Grid Trading
AI parameters can help users quickly review:
- The recent primary price range;
- A recommended number of grids;
- Historical return per grid;
- The backtested performance of the parameters.
However, AI recommendations answer the question of what worked in the past. The user must determine whether the market is still following the same structure.
Before using AI parameters, users should check:
- Whether the current price remains inside the recommended range;
- Whether major upcoming events could invalidate the range;
- Whether current volatility resembles the backtesting period;
- Whether the market has shifted from a range into a trend;
- Whether the return per grid remains meaningful after fees;
- Whether the user is willing to hold the base asset.
A more responsible approach is to treat AI parameters as a starting reference and adjust them according to current conditions rather than treating backtested returns as a forecast.
What Should Users Monitor After the Grid Starts?
A spot grid automates execution, but it is not a strategy that can be ignored completely.
Users do not need to check the price every minute, but they should regularly monitor five areas.
1. The Current Price’s Position Within the Range
If price remains near the middle of the range, the original structure may still be valid.
If it remains close to either boundary, the market may be preparing to move directionally.
2. Grid Profit and Total Profit
Grid profit reflects completed buy-and-sell spreads. Total profit also includes the unrealized return on the remaining assets.
If grid profit continues increasing while total profit declines, the unrealized loss on the base asset is probably expanding.
3. The Ratio Between Base and Quote Assets
A rising base-asset ratio indicates that the market has generally moved downward and the strategy is continuing to buy.
A rising USDT ratio indicates that the market has generally moved upward and the strategy is progressively selling the base asset.
Changes in this ratio can reveal when a range strategy has become a one-directional inventory accumulation strategy.
4. Execution Efficiency Over Time
More trades do not necessarily mean a better strategy.
Users can monitor:
- How many matched trades are completed each day;
- How much net profit each completed pair generates;
- What percentage of gross profit is consumed by fees;
- Whether the resulting return justifies continuing to allocate the capital.
5. Whether the Market Structure Has Changed
If highs and lows continue moving downward, the previous range may be developing into a downtrend.
If price breaks resistance with expanding volume and remains above it, the market may be entering a directional rally in which a fixed grid is no longer suitable.
When Should the Upward-Adjustment Function Be Enabled?
The SuperEx upward-adjustment function allows the strategy to move its active range higher after price exceeds the current upper boundary plus one grid interval.
The system cancels the lowest buy order and creates a new order near the previous upper boundary, allowing the grid to continue operating at higher price levels. Introduction to the SuperEx Spot Grid Upward-Adjustment Function
The function may be suitable when:
- The market is rising through repeated fluctuations;
- Highs and lows are both moving upward;
- The user remains constructive on the asset;
- The user is willing to continue holding or buying at higher prices;
- The user does not want the grid to stop after an upside breakout.
However, users must understand one important characteristic: The grid can automatically move upward, but it does not automatically move downward.
If the grid moves up several times and the market then reverses sharply:
- The original lower buy orders have already been canceled;
- The new buying levels are higher;
- The strategy may accumulate assets at elevated prices;
- The current price may fall below the new lower boundary;
- Unrealized losses may expand quickly.
Users should therefore define a clear upward-adjustment stopping price and reassess the stop-loss level after each range shift.
Establish Clear Termination Rules
A complete grid strategy should know how it will end before it begins.
SuperEx allows users to configure a trigger price, take-profit termination price, stop-loss termination price, and whether the base asset should be sold when the strategy ends.
Termination rules can be designed for several scenarios.
Price Falls Below the Lower Boundary
If price briefly moves below the range and then returns, the user may continue observing.
If price breaks support and establishes a bearish structure, the user should consider:
- Stopping the grid;
- Avoiding further capital additions;
- Deciding whether to retain the base asset;
- Reassessing whether the trading pair remains suitable for a grid.
Price Breaks Above the Upper Boundary
The user may choose to:
- Stop the strategy and retain the remaining asset;
- Stop the strategy and sell the base asset;
- Enable upward adjustment;
- Create a new grid based on the updated structure.
The correct choice depends on whether the user wants continued exposure to the rally.
Volatility Declines Significantly
If price no longer crosses the grid lines, capital may remain allocated with limited efficiency.
Users may assess whether to:
- Reduce the grid interval;
- Rebuild the range around the current market;
- Reallocate funds to another purpose;
- Continue operating if the expected return still justifies the capital usage.
Liquidity Deteriorates
If spreads widen, volume declines, or order-book depth falls materially, users should consider terminating the strategy rather than simply narrowing the grid interval to create more trades.
A Practical Grid Review Process
Before Creation
- Is the market ranging or gradually trending upward?
- Does the trading pair have sufficient liquidity?
- Would I be willing to hold the asset after a decline?
- Is the current price positioned appropriately within the range?
- Can net profit per grid cover trading costs?
- Can the investment amount support all planned orders?
- What condition would invalidate the lower boundary?
- How long is the strategy expected to run?
During Operation
- Is the current price still inside the range?
- What are the grid profit and total profit?
- Is the proportion of the base asset increasing rapidly?
- Are fees consuming too much of the gross return?
- Is execution frequency consistent with expectations?
- Has the market shifted into a directional trend?
- Are the original take-profit and stop-loss settings still valid?
At Termination
- Should the remaining base asset be sold?
- Can the order book support a market exit?
- Has grid profit covered floating losses and fees?
- Is the strategy ending because it succeeded or because its parameters failed?
- Is there a reason to create a new grid immediately?
- Which parameters should be adjusted next time?
Final Thoughts: The Best Grid Is Not the Busiest, but the Most Controllable
Grid trading is often misunderstood as an automated tool that generates returns after a few parameters are entered.
In reality, a mature grid strategy must manage:
- The price range;
- Grid density;
- Net return per grid;
- Changes in asset allocation;
- Liquidity;
- Market structure;
- Exit conditions.
SuperEx provides AI parameters, manual creation, arithmetic grids, geometric grids, trigger prices, take-profit and stop-loss controls, and upward adjustments. These tools solve execution problems, but the user must still decide when the strategy should operate and when it should end.
An effective grid does not necessarily complete the most trades or display the highest short-term annualized return.
It should:
- Continue executing while price remains inside the intended range;
- Keep trading costs under control;
- Maintain asset-allocation changes consistent with the user’s expectations;
- Stop when the market structure changes;
- Prevent an incorrect judgment from affecting all available capital.
Everyday users do not need to find a set of parameters that works forever, because the market will not maintain the same structure forever.
A more practical objective is to build a process that can be reviewed, adjusted, and terminated under clear conditions. Only then can spot grid trading develop from a simple automated-ordering tool into a strategy for improving capital-management efficiency.
Disclaimer
This article is provided solely for product education, trading education, and risk-management purposes. It does not constitute investment advice, trading advice, or any guarantee of returns. Spot grid trading may still generate losses because of sustained price declines, range breakouts, deteriorating liquidity, trading fees, slippage, or unsuitable parameters.
AI-generated parameters, historical backtested returns, and annualized-return figures do not represent future performance. Users should participate according to their financial circumstances, experience, and risk tolerance and refer to the live SuperEx interface and official product rules.




Responses