
How Can Everyday Users Use Spot Grid Trading to Optimize Their Returns?

#Spot #SuperEx #SpotGrid
Crypto markets do not move continuously upward or downward. More often, prices fluctuate within a range: rising and pulling back, falling and recovering, without forming a sustained directional trend.
These conditions can be difficult for manual traders. Chasing a rally may result in buying near a short-term high, while waiting for a breakout may mean missing repeated price swings. Even when traders correctly identify a range, continuously monitoring the market and executing multiple trades around the clock is rarely practical.
Spot grid trading is an automated strategy designed for this type of environment.
With SuperEx Spot Grid, users can define a price range, number of grids, and investment amount. The system then automatically buys and sells at different price levels inside that range. Instead of predicting the next candle, the strategy attempts to convert repeated volatility into multiple spread-capturing trades.
However, spot grid trading is not a guaranteed-profit tool. Optimizing results requires selecting an appropriate trading pair, understanding the market structure, and balancing the price range, grid density, and exit conditions.

The Real Value of a Spot Grid Is Repeated Execution
Everyone understands the idea of buying low and selling high. The difficult part is executing it consistently.
Suppose an asset trades between 90 and 110 USDT for an extended period. A manual trader may hesitate to buy when the price falls to 94 USDT and then refuse to sell when it rebounds to 102 USDT because of fear that it may continue rising.
A grid strategy does not make decisions based on these emotions. The user can divide the 90–110 USDT range into multiple levels, such as:
- 90 USDT;
- 92 USDT;
- 94 USDT;
- 96 USDT;
- 98 USDT;
- 100 USDT;
- 102 USDT;
- 104 USDT;
- 106 USDT;
- 108 USDT;
- 110 USDT.
If the price declines from 100 to 98 USDT, the system executes a buy order. If the price later returns to 100 USDT, it executes a sell order. Once the pair of orders is completed, the grid captures the price difference between the two levels.
If the market continues fluctuating inside the range, the system can repeat this process. The strategy does not depend on one large price increase. It depends on price repeatedly crossing the grid levels.
Step One: Determine Whether the Market Is Suitable for a Grid
Spot grids generally perform best in range-bound markets and in gradually rising markets that continue to produce pullbacks and rebounds.
Users can assess the market by asking:
- Has price repeatedly found support near similar levels?
- Has resistance repeatedly limited upward movement?
- Are the highs and lows forming a relatively stable range?
- Is the market lacking a sustained high-volume breakout?
- Does price frequently return after leaving the range?
- Does the trading pair have sufficient volume and market depth?
Grid performance changes with the market structure.
Sideways Markets
This is the most typical environment for a grid strategy.
Repeated movement between upper and lower boundaries allows the system to complete multiple buy-and-sell pairs. If the profit per grid is sufficient to cover trading costs, more price crossings may create more opportunities to accumulate grid profit.
Gradually Rising Markets
If the market is slowly moving upward while still producing regular pullbacks, an ordinary grid may continue operating until the price eventually breaks above the original upper limit.
SuperEx provides an upward-adjustment function. Once the relevant condition is reached, the system can shift the entire grid range upward and continue operating at higher price levels.
However, an upward-adjusted grid does not automatically move downward after a pullback. If the market rises, triggers several upward adjustments, and then falls sharply, the new range may no longer suit the current price.
Rapid One-Way Rallies
When the price rises quickly through the grid, the strategy may progressively sell the base asset. It may realize several grid profits but still underperform a simple buy-and-hold position during a strong rally.
This is the opportunity cost of grid trading: repeatedly realizing smaller spreads may reduce exposure to the full upward move.
Sustained Downtrends
When price continues falling through the grid, the strategy buys more of the base asset at progressively lower levels. If there is no meaningful rebound, the account may accumulate a growing unrealized loss.
Positive grid profit does not necessarily mean the overall strategy is profitable. During a sustained decline, completed spread income may be insufficient to offset the loss on the remaining holdings.
Step Two: Choose an Appropriate Trading Pair
Not every tradable asset is suitable for a grid strategy.
Everyday users should generally prioritize:
- Trading pairs with relatively stable volume;
- Assets with narrower bid-ask spreads;
- Markets with sufficient order-book depth;
- Assets they would still be willing to hold after a decline;
- Projects with lower risks of sudden suspension or disappearing liquidity;
- Assets with active but not completely disorderly volatility.
A practical question should guide the selection:
If the grid buys more of this asset during a decline, would I still be comfortable holding it?
If the answer is no, the asset may not be suitable for a spot grid.
Low-liquidity tokens may offer greater volatility, but they can also create execution failures, wider spreads, higher slippage, and difficulties when terminating the strategy. SuperEx’s official grid rules note that insufficient order-book depth may cause a grid to fail during creation or operate abnormally. SuperEx Spot Grid Notes
Step Three: Set a Reasonable Price Range
The selected price range determines where the grid operates.
If the range is too narrow:
- Price may quickly break above or below it;
- The strategy may stop operating effectively;
- The user may need to rebuild it repeatedly;
- Normal market volatility may not be adequately covered.
If the range is too wide:
- Capital is distributed across a larger price area;
- Some orders may remain untouched for long periods;
- Capital efficiency may decline;
- Grid execution frequency may be too low.
When setting the range, users can consider:
- Recent support and resistance levels;
- The primary trading range over the selected lookback period;
- Highs and lows on daily or four-hour charts;
- Average market volatility;
- Upcoming events;
- The intended duration of the strategy.
The lower limit should not simply represent a price that the user hopes will hold. It should represent a level below which the market structure may need to be reassessed.
Likewise, the upper limit should not be an arbitrary target. Users should decide whether they want the grid to stop, continue holding the asset, or move upward after the upper boundary is broken.
Step Four: More Grids Are Not Always Better
The number of grids determines how many smaller intervals are created inside the selected range.
With more grids:
- Adjacent orders are closer together;
- Trades may occur more frequently;
- Profit per completed grid is usually smaller;
- Capital is divided across more orders;
- Cumulative trading fees may increase.
With fewer grids:
- Adjacent orders are farther apart;
- Profit per completed grid may be larger;
- Orders may take longer to fill;
- Smaller price movements may not trigger trades;
- Capital is more concentrated.
The best grid count is not necessarily the one that produces the most transactions. It is the one that leaves a meaningful net return per grid after trading costs.
SuperEx’s official guidance suggests that beginners may use a single-grid return of around 1% as a starting reference, but this is not a universal rule. Asset volatility, fees, strategy duration, and market depth must still be considered.
Dividing a narrow range into too many grids may make the strategy appear highly active, while fees and slippage consume much of the spread earned from each completed trade.
How Should Users Choose Between Arithmetic and Geometric Grids?
SuperEx Spot Grid supports both arithmetic and geometric modes. Introduction to SuperEx Spot Grid Trading
Arithmetic Grid
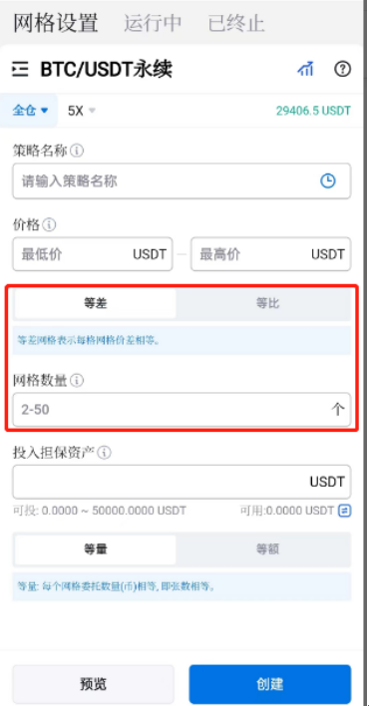
An arithmetic grid maintains the same absolute price difference between adjacent levels.
For example:
- 90 USDT;
- 92 USDT;
- 94 USDT;
- 96 USDT.
Each grid has an interval of 2 USDT.
This method is intuitive and can be suitable for relatively concentrated price ranges or for users who prefer fixed price intervals.
Geometric Grid
A geometric grid maintains the same percentage difference between adjacent levels.
As the market price rises, the absolute distance between adjacent grids becomes larger, while the percentage difference remains consistent.
This may be more appropriate for:
- Assets trading across a wider price range;
- Markets where volatility is better understood in percentage terms;
- Strategies seeking a similar return ratio across different price levels.
In simple terms, arithmetic grids focus on a fixed price difference, while geometric grids focus on a fixed percentage difference.
Manual Creation or AI Parameters?
SuperEx provides two methods for creating a spot grid: manual creation and AI-generated parameters.
AI Creation
AI mode uses historical backtesting data and algorithms to generate reference parameters. The user mainly needs to confirm the investment amount before creating the strategy.
It can be suitable for:
- Users trying spot grid trading for the first time;
- Users who are not yet familiar with parameter design;
- Users seeking a quick historical-data reference;
- Users who want to observe how a grid operates.
However, backtested performance only describes how the parameters behaved during a past period. It does not guarantee the same result in the future. When the market structure changes, a previously effective range may quickly become unsuitable.
Manual Creation
Manual mode allows users to configure:
- The lowest price;
- The highest price;
- The number of grids;
- The investment amount;
- Arithmetic or geometric mode;
- The trigger price;
- Take-profit price;
- Stop-loss price;
- Upward-adjustment settings;
- Whether the base asset should be sold when the strategy ends.
Manual mode is better suited to users who can assess the trading range and want control over the complete strategy.
A practical method is to review the AI parameters and their historical range first, then adjust them according to the current market structure rather than adopting them without analysis.
How Should Everyday Users Allocate Capital?
A grid strategy distributes the invested capital across multiple buy and sell orders. Users should therefore avoid committing all available assets to a single grid.
A more balanced capital structure may include:
- Funds allocated to the active grid;
- Reserve funds outside the grid;
- Long-term holdings;
- A security reserve not used for trading.
If a user has a long-term conviction in an asset, one portion can remain in a holding position while another is allocated to the grid.
This structure can:
- Preserve exposure to a major long-term rally;
- Use grid funds to capture range volatility;
- Keep reserves available for strategy adjustments;
- Prevent one failed grid from affecting the entire portfolio.
Everyday users should particularly avoid:
- Investing all available USDT in one grid;
- Running several highly correlated grids simultaneously;
- Repeatedly adding funds during a rapid decline;
- Narrowing the range simply to increase the displayed return;
- Allocating excessive capital because of strong short-term backtesting.
Do Not Look Only at Grid Profit: Check Total Profit
This is one of the most commonly misunderstood aspects of spot grid trading.
The SuperEx grid interface distinguishes among grid profit, floating return, and total profit.
Grid Profit
Grid profit comes from completed buy-low and sell-high order pairs. It represents spread income already realized through the strategy.
Floating Return
Floating return reflects the unrealized gain or loss on the base asset still held by the grid.
Total Profit
Total profit combines realized grid income with the change in the current value of the remaining assets.
A strategy may therefore show:
- Positive grid profit;
- Multiple completed buy-and-sell pairs;
- A continuing decline in the base asset;
- A floating loss larger than the grid profit;
- A negative total result.
When evaluating a grid, users should review:
- Grid profit;
- Floating profit or loss;
- Total profit;
- The amount of base asset currently held;
- Whether price remains within the active range;
- How long the strategy has been running;
- How a simple holding strategy performed during the same period.
Displayed annualized returns should not be interpreted as the amount the strategy will necessarily earn over the next year. Annualizing a short operating period can produce a figure that appears unusually high.
How Should the Upward-Adjustment Function Be Used?
An ordinary grid may stop placing new orders after price moves above the upper boundary, remaining inactive until price returns to the range.
SuperEx’s upward-adjustment function allows the strategy to shift the entire grid higher after price rises and meets the relevant trigger condition. The system cancels the lowest buy order and creates a new order near the previous upper boundary, allowing the grid to continue operating at higher price levels. Introduction to the SuperEx Spot Grid Upward-Adjustment Function
It may be suitable when:
- The market is trending upward with repeated pullbacks;
- Price may continue breaking above the original range;
- The user wants to reduce manual range adjustments;
- The user is willing to continue acquiring the base asset at higher prices.
Users must still understand that:
- The grid moves upward but does not automatically move back down;
- Upward adjustments raise some future buying levels;
- A sharp reversal may leave the strategy holding assets acquired in a higher range;
- Repeated adjustments move the strategy farther from its original low-cost area;
- A clear move-up stopping price should be defined.
The function is not designed for unlimited price chasing. Its purpose is to help the grid adapt to an orderly rising market.
When Should a Grid Be Stopped?
An automated strategy does not mean a strategy that never requires management.
Users should consider reassessing or stopping the grid when:
- Price decisively breaks below established support;
- The market changes from a range into a sustained downtrend;
- Price breaks above the range and begins a strong one-way rally;
- Liquidity in the trading pair deteriorates;
- The project’s fundamentals change materially;
- An upcoming event may alter the market structure;
- The active range no longer reflects the original thesis;
- Total grid performance remains inferior to holding or another strategy;
- The user needs access to the invested capital.
SuperEx allows users to configure a trigger price, take-profit termination price, and stop-loss termination price. A running grid can also be stopped manually.
When terminating the strategy, users should decide whether the remaining base asset should be sold. If selling is selected, the system will generally attempt to sell the remaining asset at the market price. If it is not selected, the asset can be returned to the relevant account for continued holding and management.
How Should Different Users Use Spot Grid Trading?
New Users
New users can begin with AI-generated parameters, a small investment, and a liquid major trading pair.
The immediate objective should not be maximizing profit. It should be observing:
- How the system creates buy and sell orders;
- How matched trades are completed when price crosses grid levels;
- The difference between grid profit and total profit;
- What happens when price leaves the range;
- How assets are handled after the strategy ends.
Long-Term Holders
Long-term holders may allocate part of their assets to a grid while keeping another portion as a core holding.
This preserves exposure to the longer-term trend while using part of the portfolio to capture shorter-term volatility. It also reduces the risk of the grid progressively selling the entire position during a major rally.
Users Who Cannot Monitor the Market Continuously
A spot grid can reduce the need for repeated manual orders and round-the-clock monitoring, but users should still review:
- Whether price remains inside the range;
- Whether total profit is positive;
- Whether liquidity has changed;
- Whether take-profit and stop-loss levels remain appropriate;
- Whether the market structure has shifted.
Experienced Strategy Users
More experienced users can combine grid trading with:
- Support and resistance;
- Volatility indicators;
- Volume changes;
- Trend structure;
- Arithmetic and geometric modes;
- Upward adjustments;
- Staged capital allocation.
Their advantage is not the ability to create more grids. It is the ability to recognize when the original strategy has stopped working.
Final Thoughts: A Grid Optimizes Execution, Not Market Outcomes
The most important value of a spot grid is its ability to turn a user’s range-market thesis into a repeatable set of trading rules.
It can reduce emotional interference, automate repeated transactions, and continue capturing range volatility when the user cannot monitor the market around the clock. SuperEx provides AI-generated parameters, manual creation, arithmetic and geometric grids, trigger prices, take-profit and stop-loss controls, and upward adjustments, allowing users with different experience levels to construct suitable strategies.
However, a grid cannot automatically turn an incorrect market judgment into a correct one.
When the range is reasonable, liquidity is sufficient, profit per grid covers transaction costs, and the market continues producing two-way volatility, a grid may improve capital utilization.
When price enters a sustained decline, the grid may accumulate more of the base asset. When price rises rapidly, it may sell the asset too early. Users must still understand the market structure and prepare an exit plan for a range breakout.
The variables that everyday users should optimize are not simply the number of grids or a short-term annualized-return figure. They should optimize the complete strategy:
- Why this asset was selected;
- Why this price range is appropriate;
- Whether profit per grid can cover costs;
- How much capital can be allocated;
- Under what conditions the strategy should stop;
- Whether the base asset should be held after termination.
Only when these questions have clear answers can spot grid trading become more than an automated ordering tool and serve as a structured approach to asset management.
Disclaimer
This article is provided solely for product education, trading education, and risk-management purposes. It does not constitute investment advice, trading advice, or any guarantee of returns. Spot grid trading remains exposed to digital-asset volatility, declining liquidity, slippage, transaction fees, range breakouts, and unrealized holding losses.
AI-generated parameters and historical backtesting do not represent future performance. Positive grid profit does not necessarily mean positive total profit. Users should participate according to their financial circumstances, experience, and risk tolerance and refer to the live SuperEx interface and official product rules.




Responses