
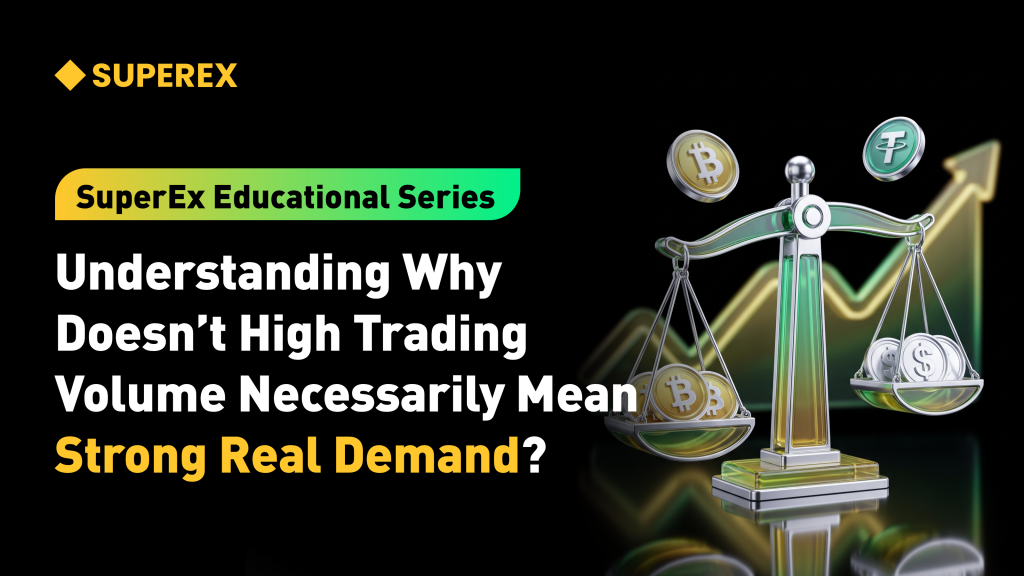
SuperEx Educational Series: Understanding Why Doesn’t High Trading Volume Necessarily Mean Strong Real Demand?

#SuperEx #EducationalSeries #CryptoTrading
When people want to know whether a token is gaining traction, the first number they often check is its 24-hour trading volume.
The price rises 20%, volume increases fivefold, social media fills with posts, and someone in the group chat delivers the classic conclusion: “With volume this high, the demand must be real.”
Not so fast. The number may be real, but what it represents is a separate question.
The same capital can circulate repeatedly between buyers and sellers.
- Market makers can continuously quote and generate large turnover.
- Arbitrage bots can trade across venues again and again.
- Leveraged liquidations can produce enormous volume within minutes.
- In more extreme cases, related accounts can trade with one another, making the market look crowded even though only a handful of participants are involved.
Trading volume tells us how much the market moved through transactions. By itself, it does not tell us how much new capital entered, how many participants intend to hold, or whether the trades came from independent users.
Volume matters, but it is not a lie detector for demand.

What Does Trading Volume Actually Measure?
Trading volume usually measures the value or quantity of completed trades during a given period.
Suppose Alice buys 10,000 USDT worth of a token from Bob. The market records 10,000 USDT in volume. Alice’s buying demand is real, but Bob’s willingness to sell is equally real.
There is one frequently overlooked fact: every completed trade has both a buyer and a seller.
Volume is therefore not the same as buying volume. It measures how much value changed hands, not how much one-sided purchasing interest accumulated.
More precisely, trading volume is a gross measure, while changes in demand are closer to a net-flow question.
Imagine 1,000,000 USDT of new capital enters a market and completes one purchase. The resulting volume may be 1,000,000 USDT. In another market, the same 1,000,000 USDT may circulate twenty times through high-frequency trading, arbitrage, and short-term turnover, producing 20,000,000 USDT in reported volume.
The second market has much higher volume, but it did not receive 20,000,000 USDT in new capital. It simply kept the same money extremely busy.
This is the difference between capital inflow and capital turnover.
Real demand should not be reduced to “someone bought.” More meaningful demand exists when participants are willing to commit capital within a price range, absorb sell pressure, and continue holding or using the asset after short-term price excitement fades.
If a buyer intends to hold for only thirty seconds and immediately resell the asset, the trade is still genuine. But it represents short-term turnover rather than necessarily durable demand.
Where Can High Trading Volume Come From?
High volume does not automatically mean fake trading. Many high-frequency transactions serve legitimate economic purposes. They simply should not be confused with large numbers of new users buying the asset.
Market Making and Arbitrage: Real Activity, Not Necessarily Directional Demand
Market makers place both buy and sell orders, providing liquidity through continuous quotations. As users trade against those orders, volume grows. But market makers generally manage their net exposure rather than maintain a long-term bet on the asset’s direction.
Volume generated by market making can be genuine, useful, and beneficial. It may narrow spreads, deepen the order book, and improve execution for ordinary users. However, it reflects liquidity provision, not necessarily rising investment demand.
Arbitrage activity works in a similar way.
If a token trades at 1 USDT on Exchange A and 1.02 USDT on Exchange B, an arbitrageur may buy on A and sell on B. Both venues record volume, but the arbitrageur is not expressing a desire to hold the token. The goal is to capture the price difference through a relatively market-neutral trade.
Such trades support price discovery and bring prices across venues back into alignment. But they cannot automatically be interpreted as the market suddenly becoming bullish on the project.
Leverage and Liquidation: Panic Can Produce Enormous Volume
High volume may also result from the rapid closing of leveraged positions.
Suppose a market has accumulated a large concentration of long positions. When price falls below a critical level, stop orders, voluntary position closures, and forced liquidations may trigger one after another. Sell orders push the price lower, which activates another wave of liquidations and creates a chain reaction.
Volume may reach a recent high, but this is clearly not strong buying demand. It is forced risk reduction.
The reverse can also happen. When large short positions are liquidated, the system must buy assets or contracts to close them. Price and volume may surge together, creating the appearance of aggressive new buying, even though part of the activity is simply forced short covering.
When examining derivatives markets, volume should therefore be considered alongside open interest, funding rates, liquidation data, and spot-market behavior.
If price rises and volume surges while open interest falls sharply, the move may reflect short covering or existing positions being closed rather than a wave of new long positions.
Incentivized Trading and Wash Trading: Activity Without Lasting Demand
Some platforms or projects encourage trading through mining rewards, points, airdrop eligibility, or fee rebates. Users may repeatedly buy and sell to earn rewards rather than because they genuinely want to own the asset.
As long as the reward exceeds the cost of trading, participants have an incentive to generate turnover. Once the campaign ends, volume may collapse because the activity was driven by demand for subsidies, not demand for the asset.
A more serious case is wash trading, where the same beneficial owner trades between one or more related accounts.
The asset appears to change hands repeatedly, but its beneficial ownership does not meaningfully change. The goal may be to improve volume rankings, create an illusion of liquidity, or attract outside traders who do not understand what is happening.
In 2024, the U.S. Securities and Exchange Commission charged several so-called crypto market makers with allegedly using self-trading and bots to create artificial volume. The cases illustrate how enormous displayed volume can exist even when the underlying transactions serve little economic purpose. SEC enforcement release
It is important to distinguish legitimate market making from wash trading. Legitimate market makers assume inventory risk, provide two-sided quotations, and transact with independent participants. Wash trading uses related transactions to create interest that does not genuinely exist.
How Can We Identify Real Demand Behind Volume?
There is no magical single indicator for identifying genuine demand. A more reliable approach is to examine whether several different data points tell the same story.
First, Observe How Price Responds to Volume
If aggressive buying repeatedly absorbs available sell orders, price will generally move upward. More importantly, traders should observe whether the higher price can hold and whether buyers continue to appear during pullbacks.
If volume is enormous but price remains inside a narrow range, there may be two very different explanations.
One possibility is that deep liquidity is efficiently matching strong two-sided interest. Another is that capital is merely circulating without creating meaningful net directional demand.
At that point, it becomes necessary to examine aggressive buy and sell ratios, order-book changes, and whether large sell orders immediately reappear after being consumed.
The relationship is not simply “high volume means higher price.” Volume is closer to engine speed, while price shows how far the vehicle moved. A high engine speed may indicate acceleration, or it may mean the engine is working hard while the vehicle remains almost stationary.
Then Ask Whether Capital Remains
Short-term volume shows that an asset was traded. Changes in balances, positions, and liquidity provide more information about whether capital remained.
In spot markets, useful signals may include exchange inflows and outflows, changes in token-holding addresses, stablecoin flows, and whether assets quickly return to trading venues after being purchased.
These figures should not be interpreted mechanically. Withdrawals may indicate long-term holding, but they may also represent transfers to another exchange, DeFi participation, or a change in custody. An increase in wallet addresses may come from one user splitting funds across multiple wallets.
What matters is not a single rising number, but whether multiple signals confirm one another.
For example, steadily rising spot prices, reasonable spreads, persistent order-book depth, token withdrawals, increasing active users, and growing on-chain usage together provide much stronger evidence than a sudden spike in 24-hour volume.
Finally, Test Whether Demand Survives Over Time
Genuine demand usually has some degree of persistence.
It does not have to increase every day, and it does not prevent price corrections. But after incentives end, social-media attention fades, and airdrop expectations disappear, people should still be willing to hold, trade, use, or provide liquidity for the asset.
If volume exists only during an incentive campaign and disappears immediately afterward, the market may have been purchasing the reward rather than the token.
If volume appears only during a price spike and buyers disappear during the correction, the apparent demand may primarily reflect momentum chasing rather than long-term conviction.
Time is an important filter. Bots can generate millions of trades in a day, but it is much harder to imitate healthy user retention, stable capital formation, and continuous real usage over an extended period.
SuperEx Example: Market Quality Matters Beyond Volume
Using SuperEx as an example, evaluating a trading market cannot be limited to pursuing larger volume figures. It must also consider whether orders represent genuine and independent trading intentions, whether prices are forming normally, and whether suspicious related-account behavior exists.
SuperEx’s abnormal-trading rules identify repeated self-trading and transactions between effectively controlled related accounts as abnormal activity. Detection may consider factors such as funding sources, IP information, synchronized trading behavior, and account relationships. SuperEx Abnormal Trading Behavior Definitions
The purpose of these rules is not merely to prevent individual accounts from obtaining improper benefits. They also protect the credibility of volume, price, and liquidity information.
If artificial trades remain embedded in market data, ordinary users may mistake apparent activity for genuine exit liquidity. Projects may misjudge user demand, while market-making and risk models may operate on contaminated information.
For an exchange, a healthy market should not be judged solely by how much traded today. It should also be evaluated through spread quality, depth stability, price continuity, abnormal-account monitoring, and the market’s ability to maintain basic order during extreme volatility.
High volume can be a positive signal. But it becomes evidence of high-quality market activity only when combined with real users, independent transactions, stable depth, and credible price discovery.
Conclusion
Trading volume answers one question: how much value changed hands during a given period?
Real demand answers a different question: how much independent capital is willing to enter near the current price, assume risk, absorb selling pressure, and remain after the excitement fades?
High volume may arise from genuine investment demand, market making, arbitrage, short-term turnover, leveraged liquidations, incentive campaigns, or wash trading between related accounts. All increase the displayed number, but their economic meanings are very different.
When volume surges, there is no need to immediately declare that a bull market has arrived. Nor should we automatically assume that all activity is fake.
A more sensible approach is to examine price response, order-book depth, spreads, open interest, capital flows, ownership changes, on-chain usage, and user retention after incentives end.
Volume measures how busy the room appears. Real demand measures how many participants are willing to stay.
Markets are very good at creating excitement. Where capital ultimately remains is usually more honest.
References
SEC: Crypto Market Manipulation Enforcement Action
CFTC: False Reporting and Wash Trading Enforcement
SuperEx Abnormal Trading Behavior Definitions
About SuperEx
As the world’s first Web3-powered cryptocurrency exchange, SuperEx remains committed to building the Web3 ecosystem through products and services including SuperEx DAO, SuperEx Web3 Wallet, Super Start, SuperEx P2P, SuperEx Stock Markets, SuperEx Copy Trading, SuperEx Earn, and SuperEx DAO Academy.
Today, SuperEx serves more than 10 million users across 166 countries and regions and supports spot and futures trading for over 1,000 crypto assets.
Click to register SuperEx
Click to download the SuperEx APP
Click to enter SuperEx CMC
Click to enter SuperEx DAO Academy — Space




Responses