
SuperEx Guide: How to Use Chart Tools and Technical Indicators

In crypto trading, many users focus on only two questions when they first open a candlestick chart: is the price going up or down, and is it still a good time to buy?
However, mature trading analysis is not just about the color of a single candlestick. It is about using chart tools, trend lines, Fibonacci tools, and technical indicators to observe price structure, support and resistance, trend rhythm, and market strength.
SuperEx provides users with TradingView chart tools and a technical indicator library, helping users conduct more intuitive market analysis before trading.
Where to Find the Candlestick Chart Tools
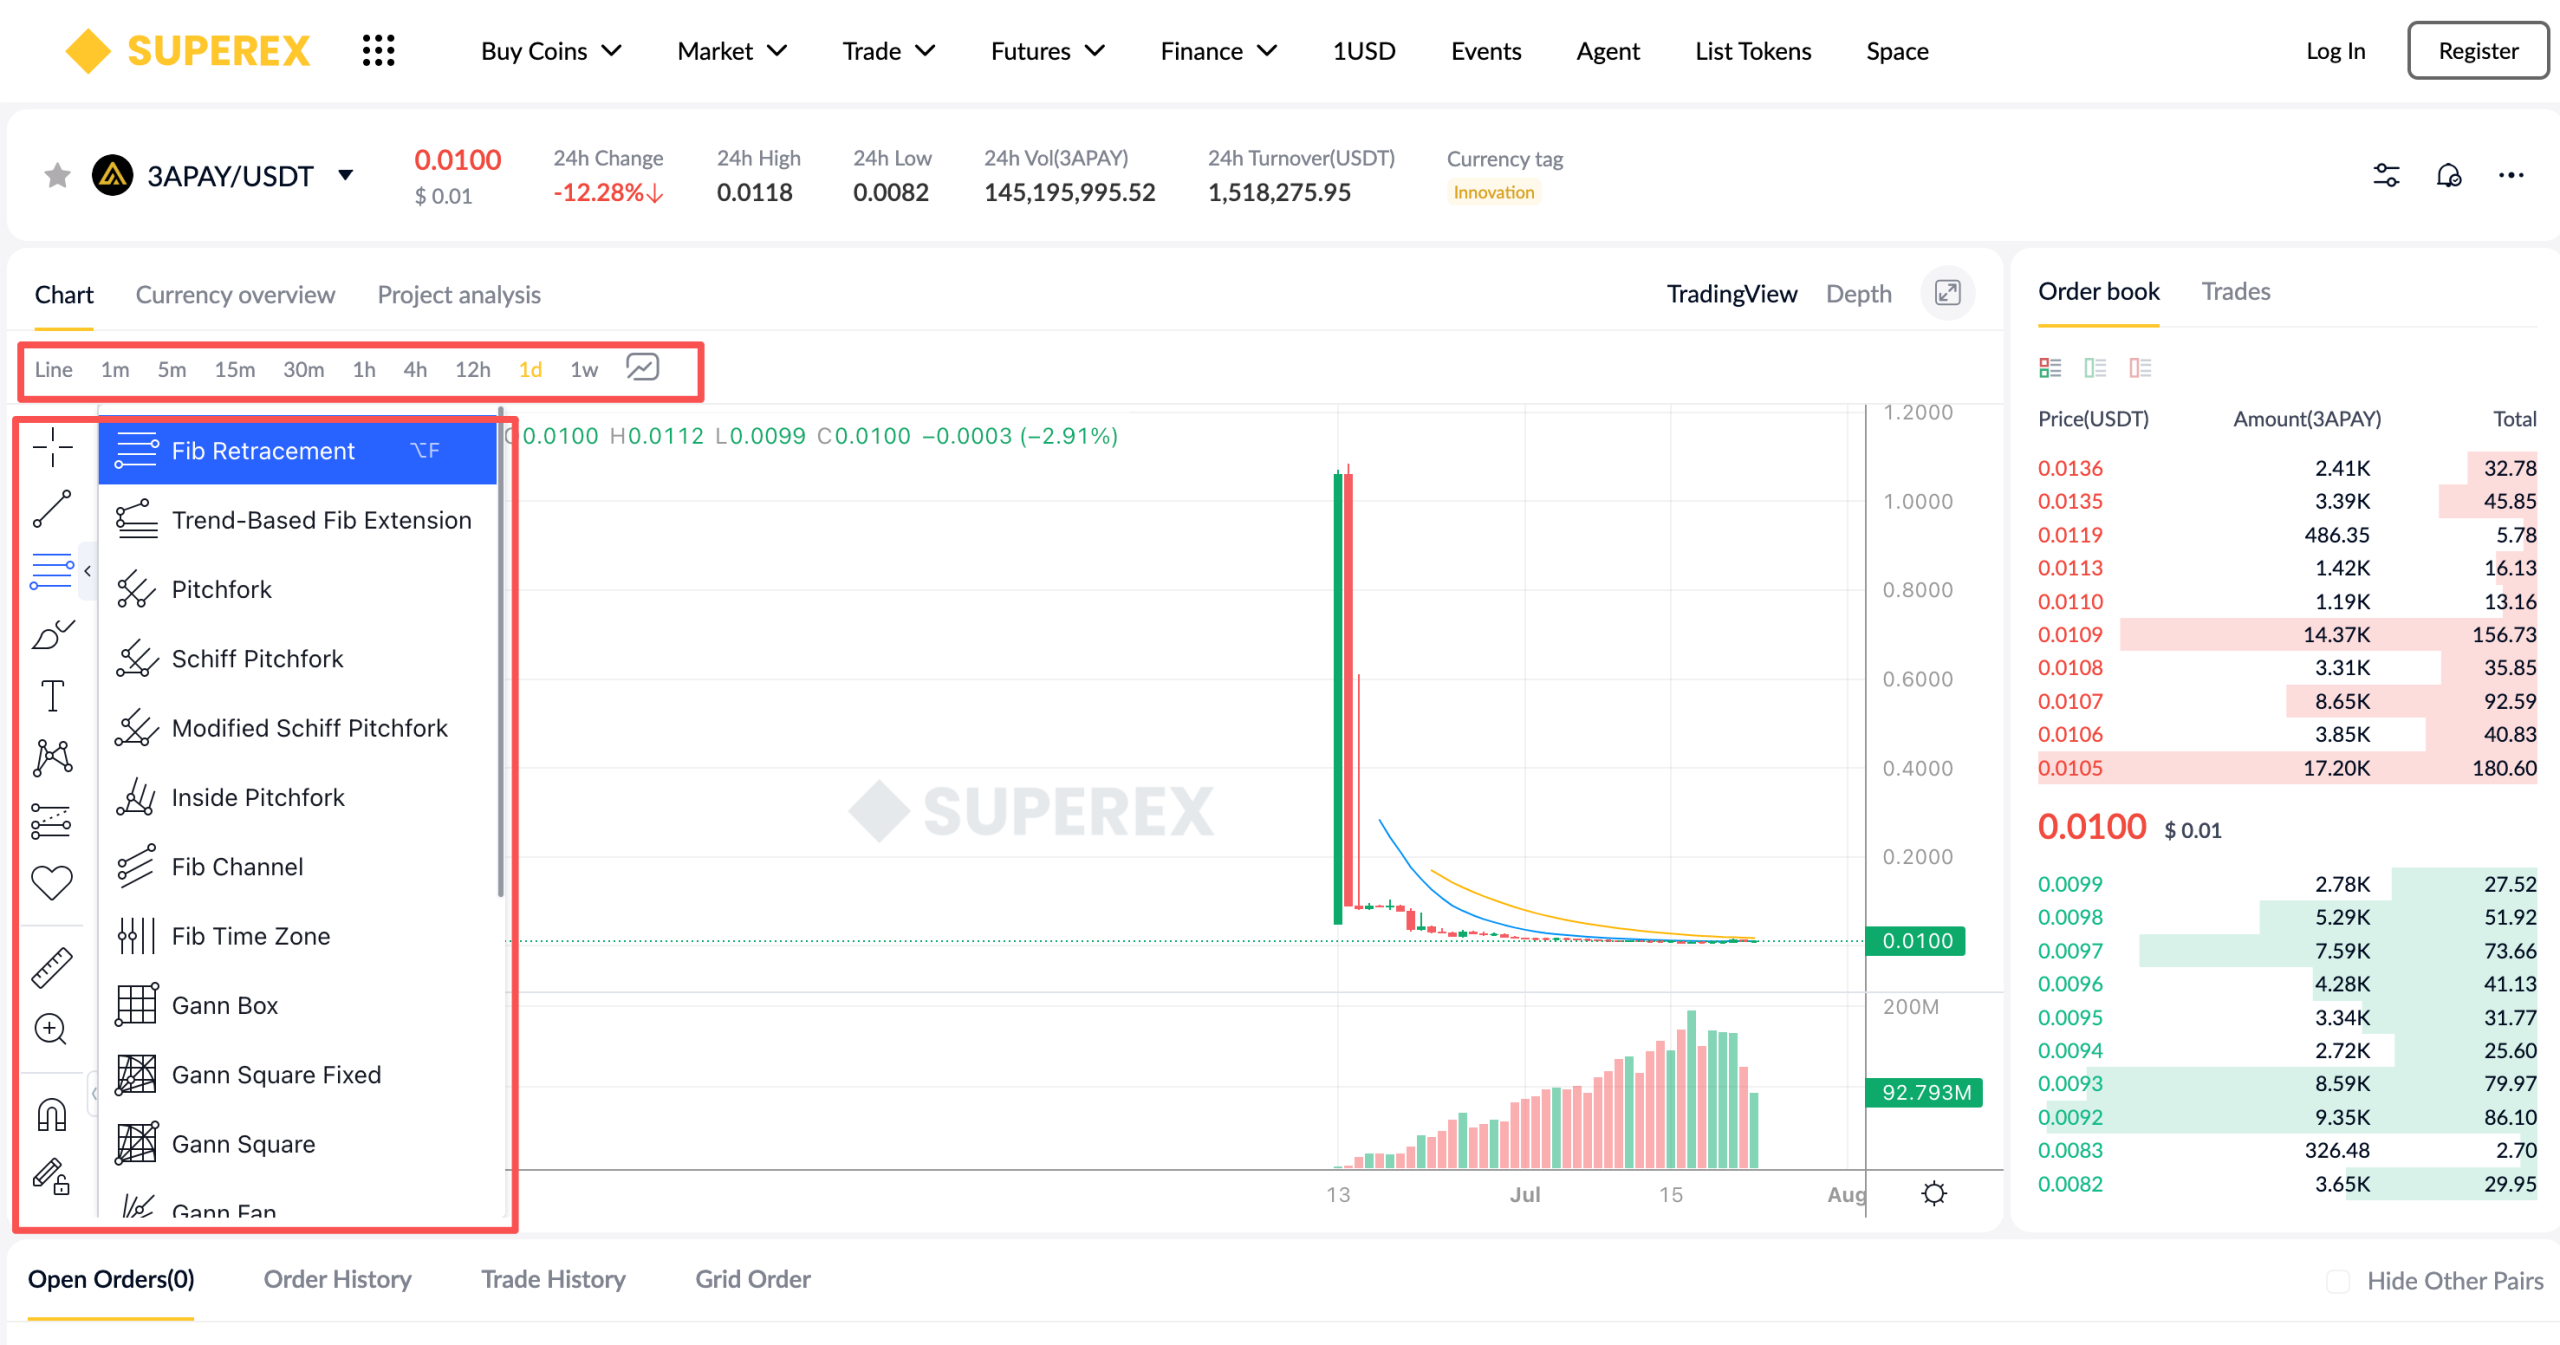
After entering the SuperEx trading page, select any trading pair, and you will see the candlestick chart area.
On the chart page, users can find:
- Timeframe options, such as 1m, 5m, 15m, 30m, 1h, 4h, 12h, 1d, and 1w
- Candlestick chart / Line chart switch
- TradingView chart option
- Drawing toolbar on the left
What Can the Left Toolbar Be Used For?
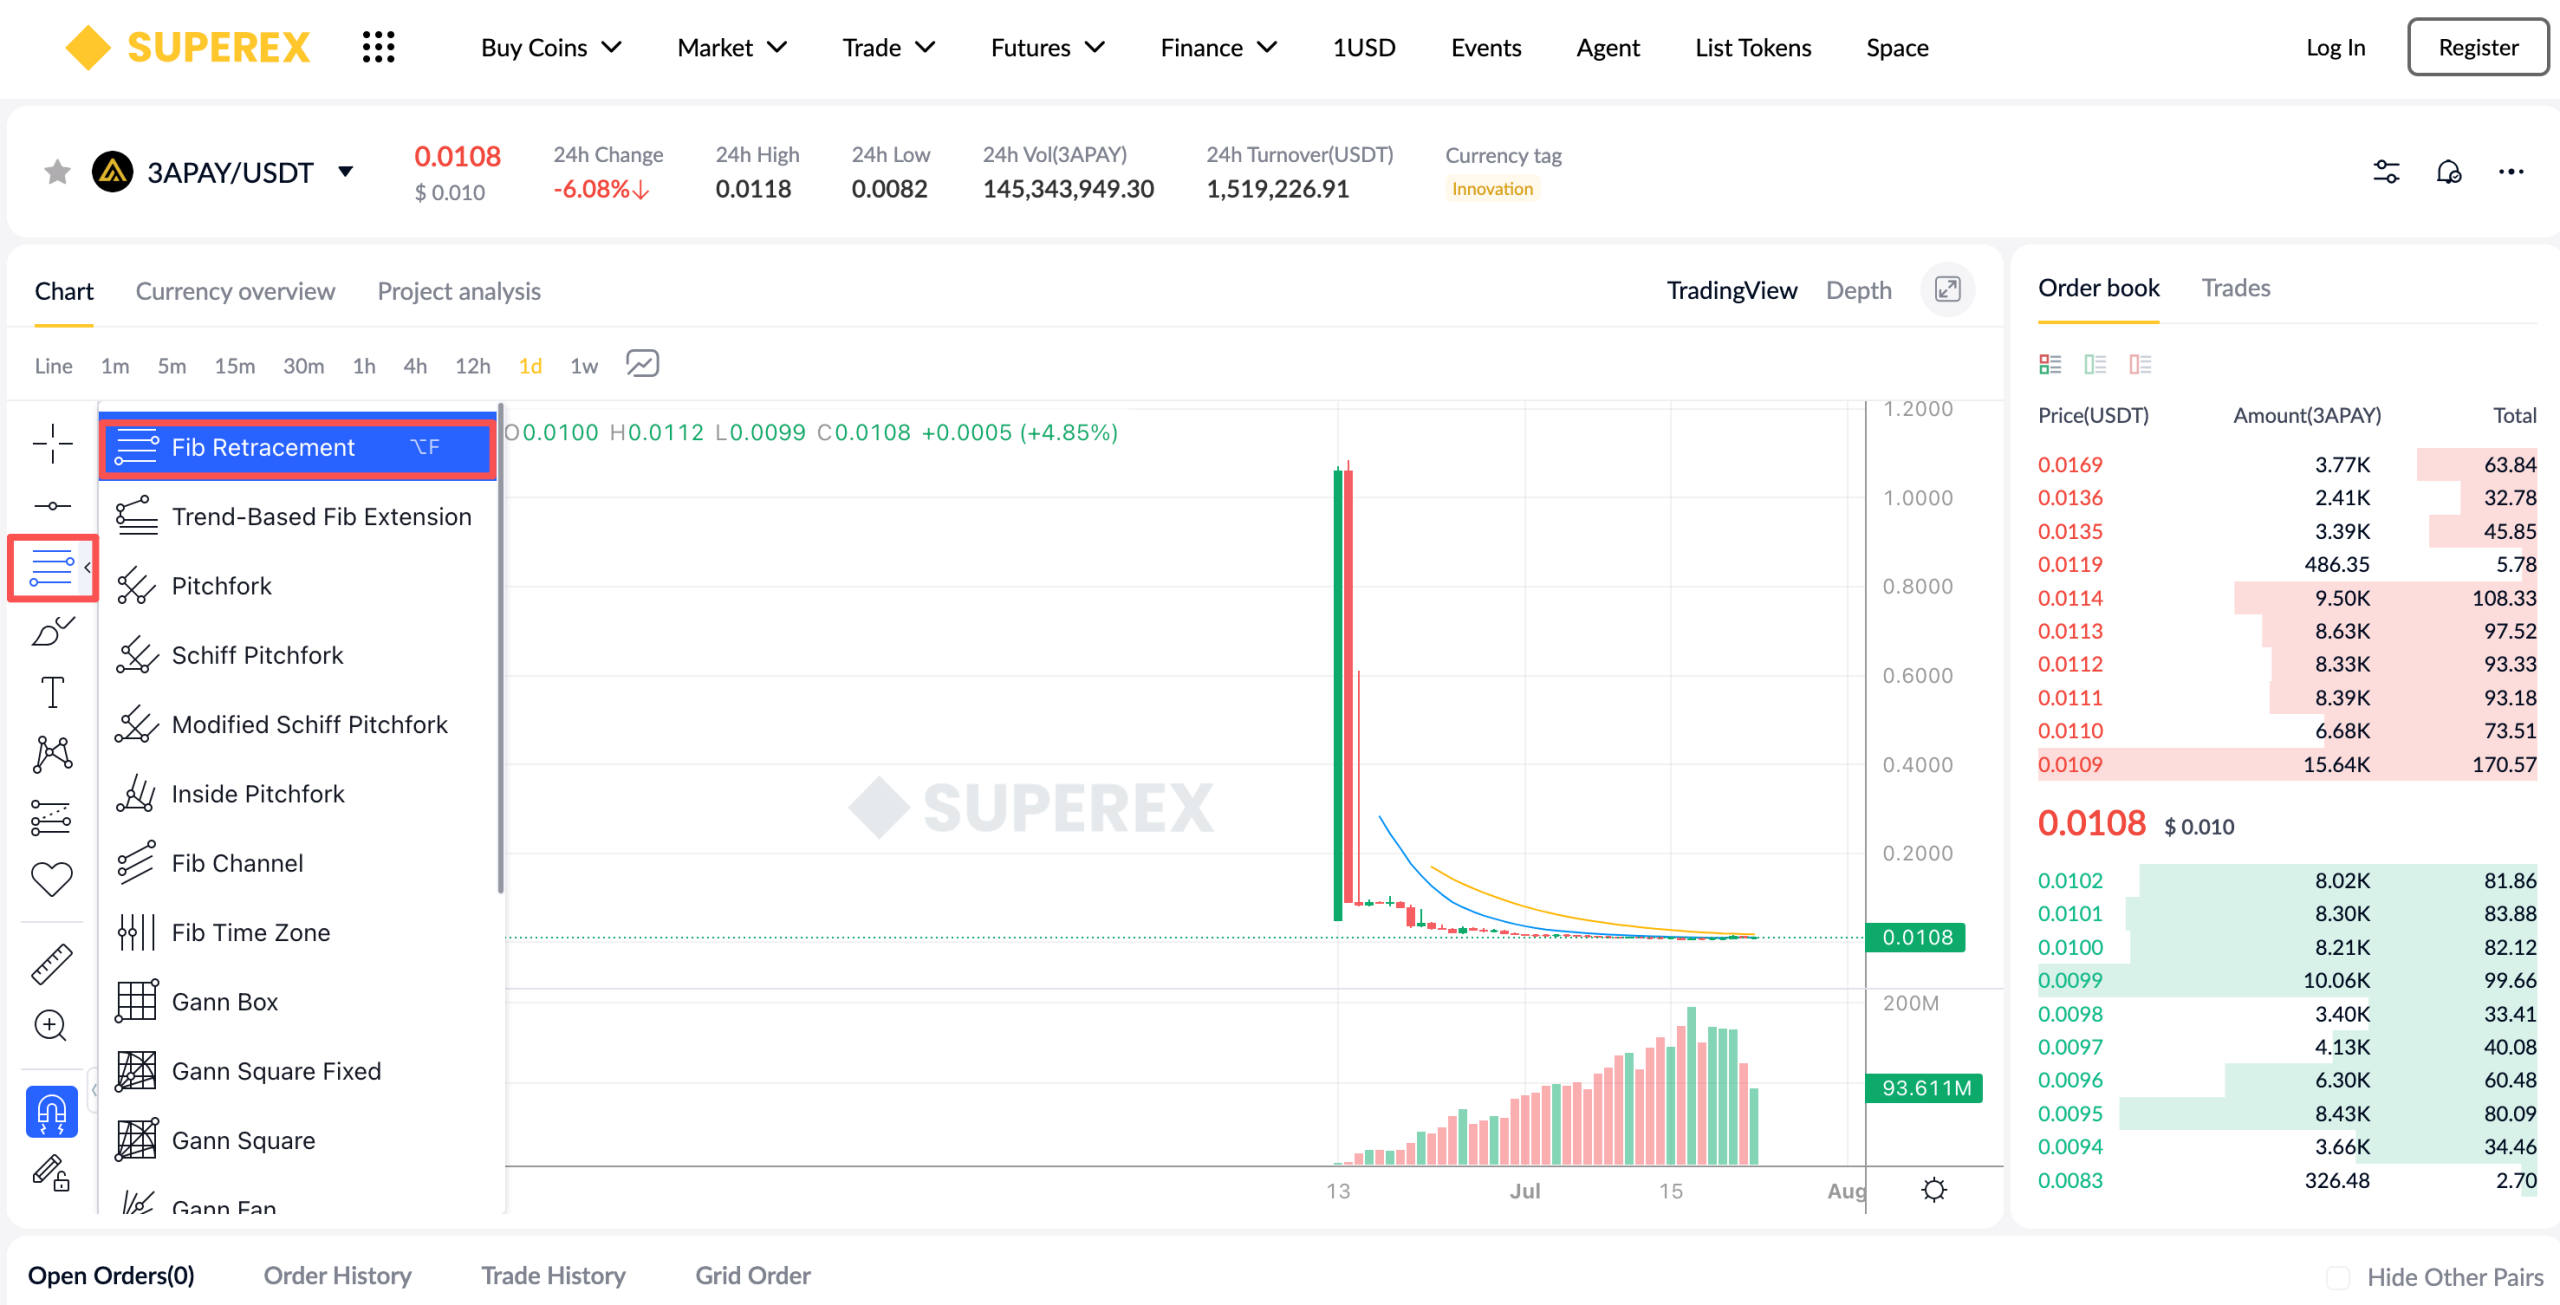
The red-box area in the image is mainly the TradingView drawing toolbar. Its purpose is not to directly provide buy or sell signals, but to help users make analysis marks on the chart.
Common tools include:
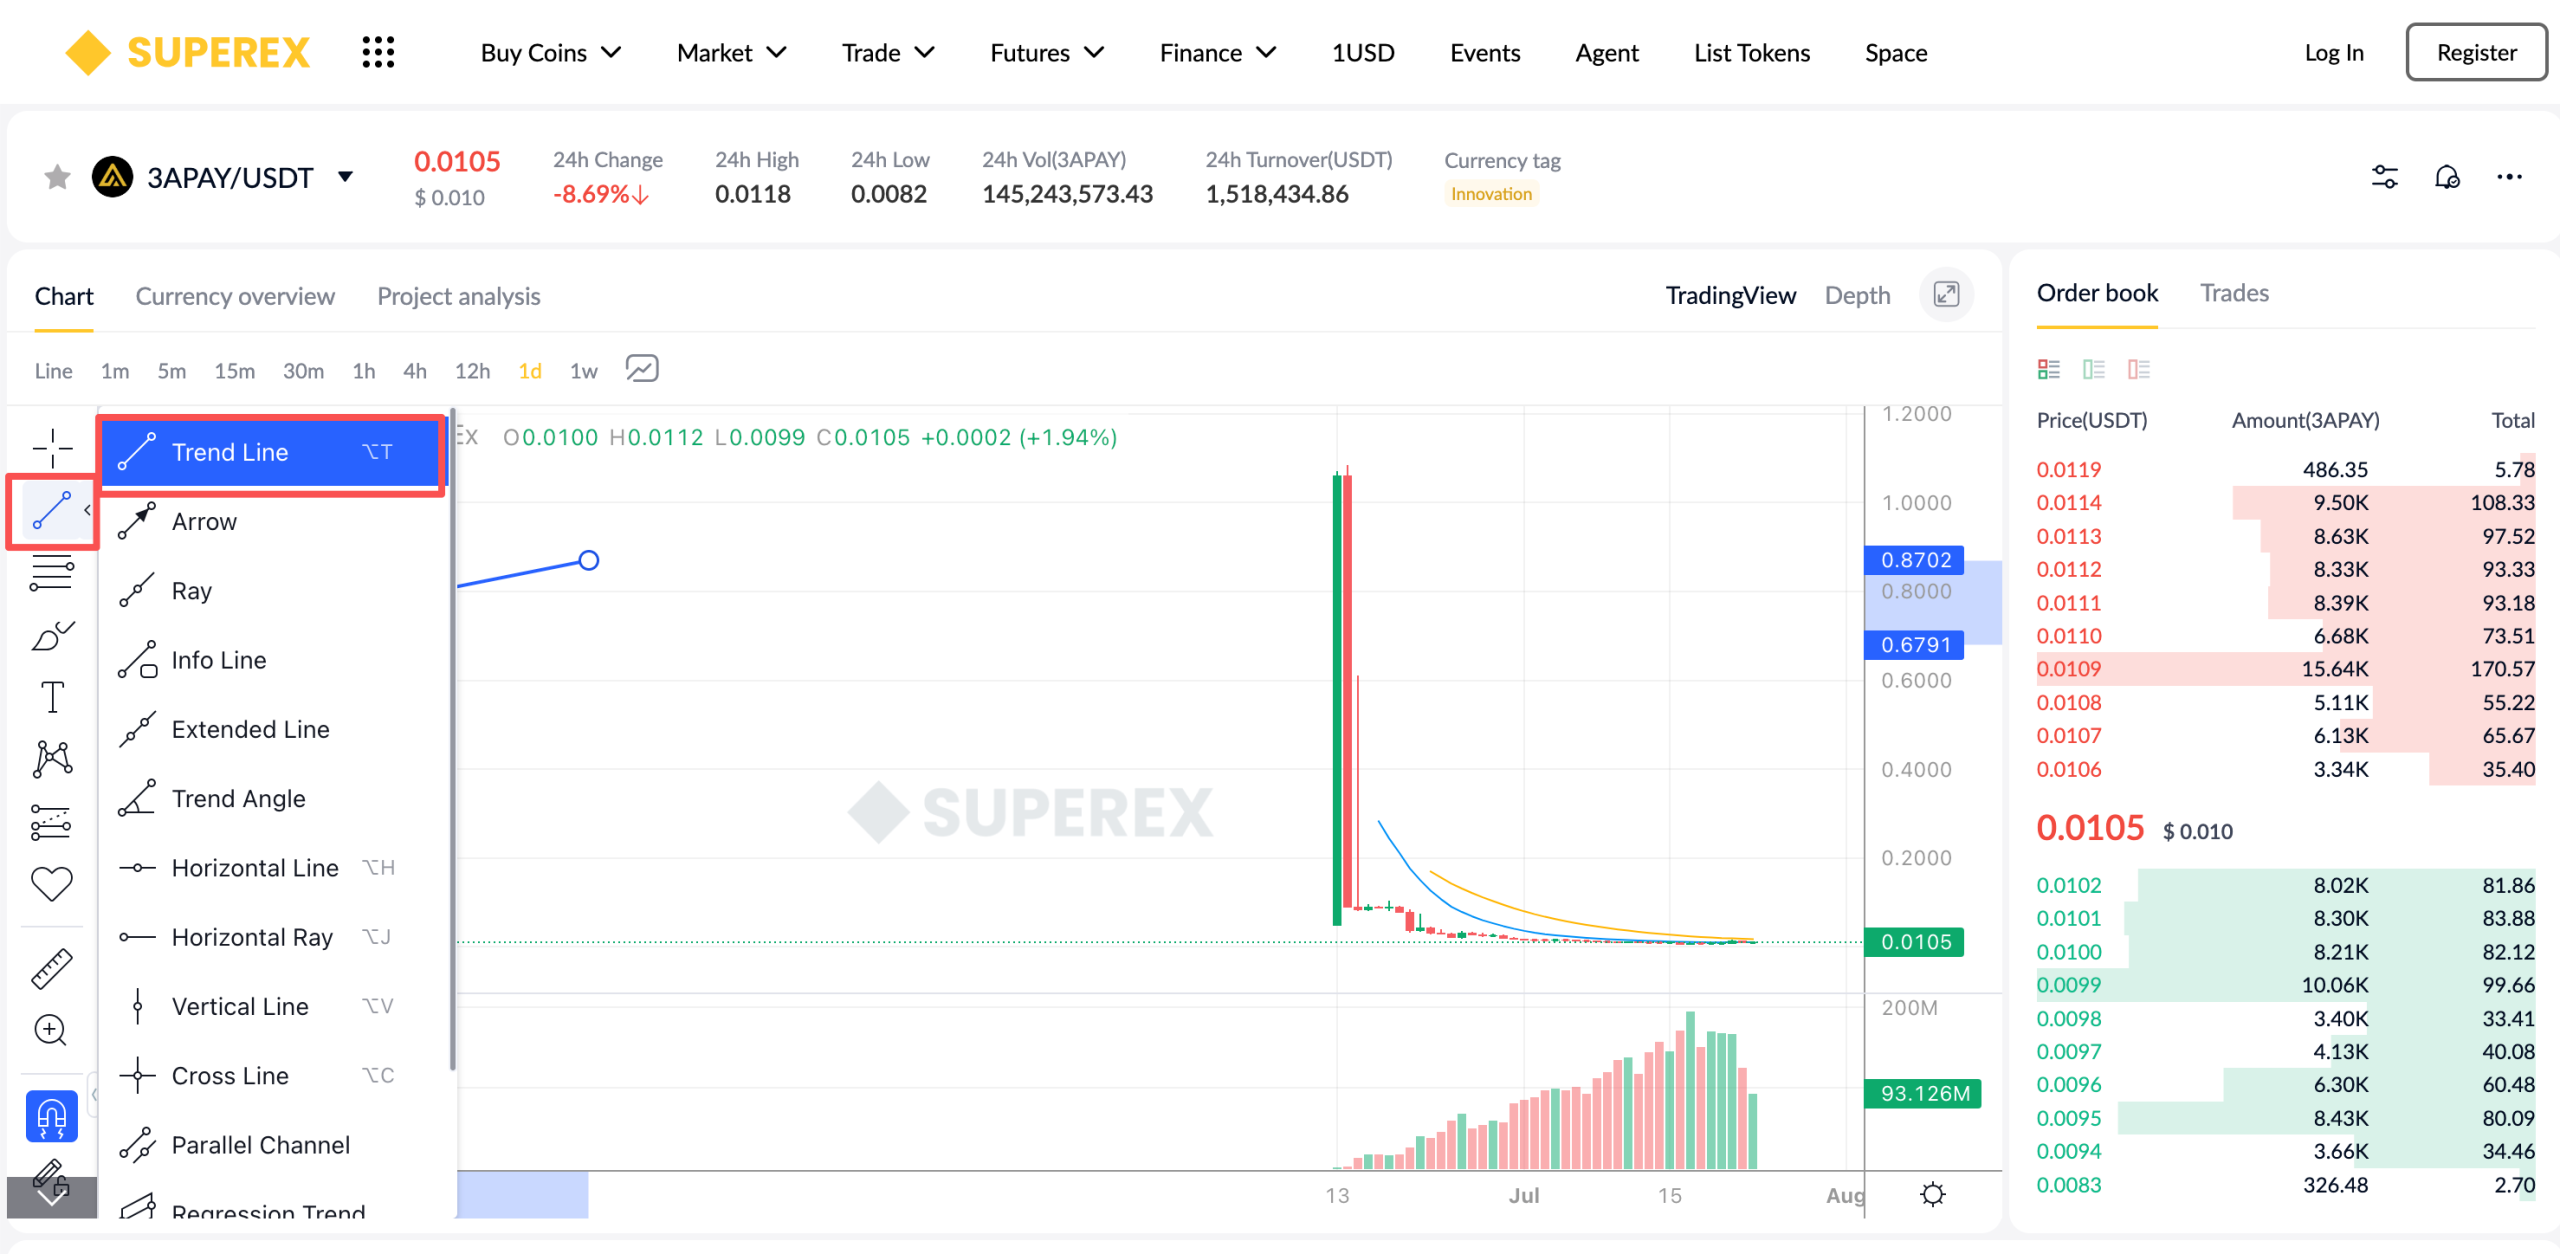
- Trend line tools: used to connect highs or lows and observe market trend direction
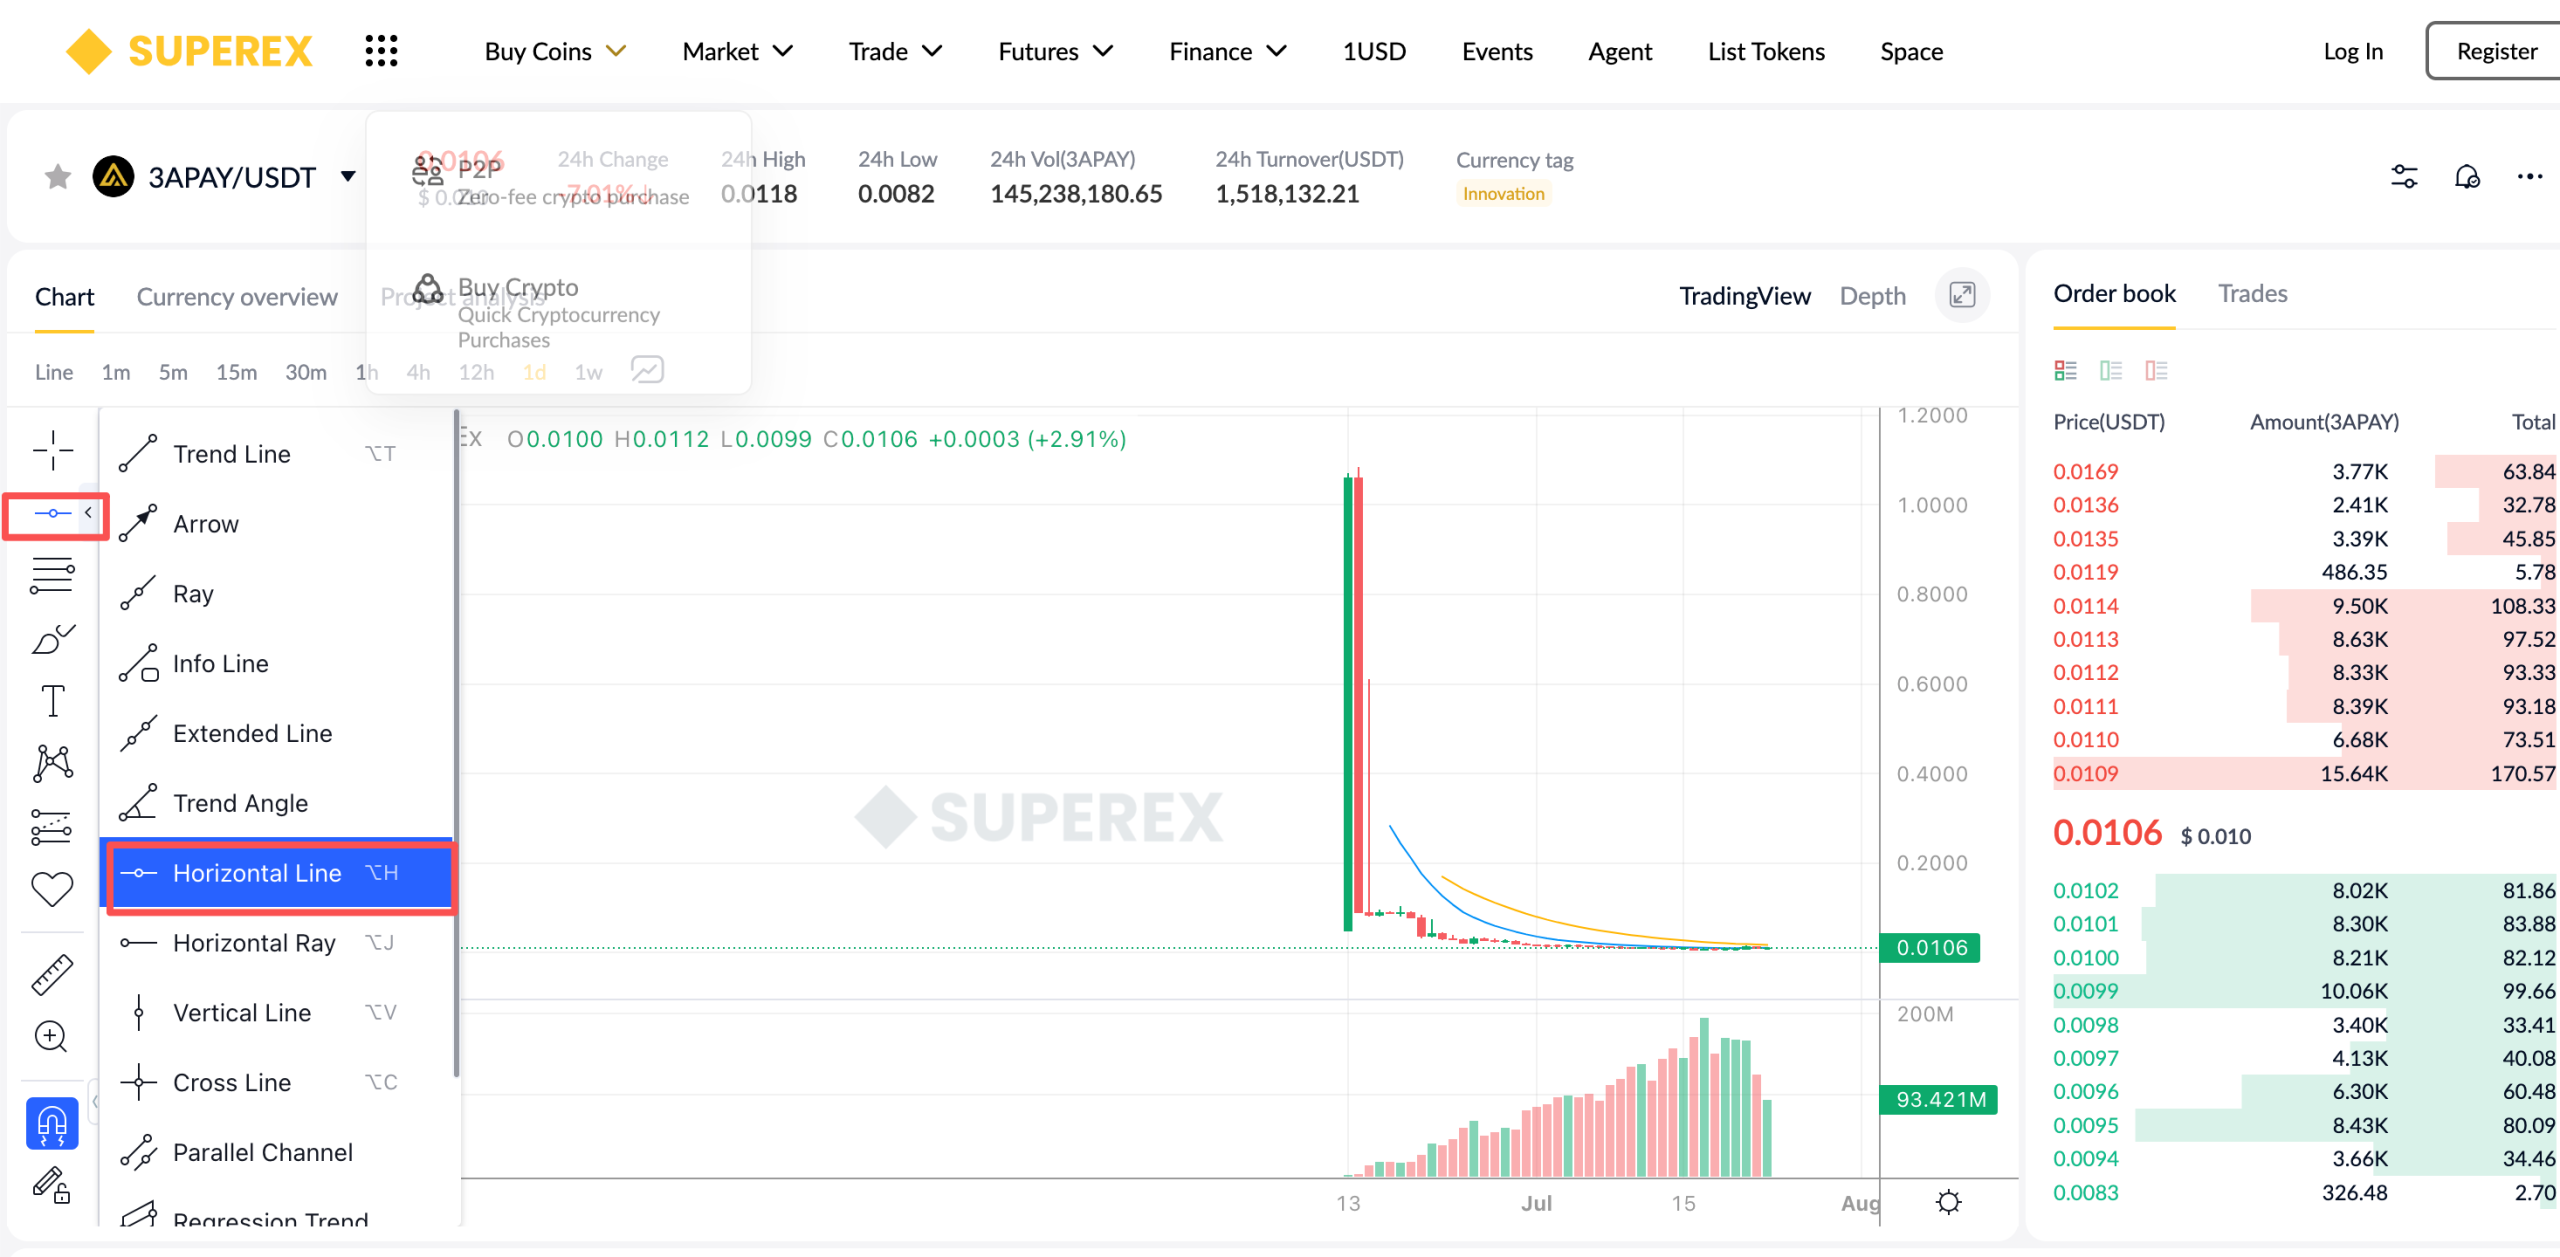
- Horizontal line tools: used to mark key support and resistance levels
- Fibonacci Retracement: used to analyze potential price pullback areas
- Fibonacci Extension: used to observe potential target levels after trend extension
- Pitchfork tools: used to judge trend channels and price movement ranges
- Fib Channel: used to observe price movement structure within a channel
- Fib Time Zone: used to analyze the timing rhythm of price changes
- Gann Box / Gann Square: used to observe market structure from both price and time dimensions
- Text and marker tools: used to record personal trading thoughts
These tools help users build their own observation framework on the chart, instead of relying only on instinct to judge the market.
Three Chart Tools Commonly Used by Beginners
If you are just starting to use candlestick analysis, you do not need to use all tools at once. You can begin with the following three types.
Trend Lines
Trend lines are one of the most basic and commonly used tools.When the price continues to form higher lows, users can connect the lows with a trend line to observe whether the uptrend is continuing. When the price continues to form lower highs, users can connect the highs to observe whether the downtrend remains in place.
Useful for observing:
- Whether the current market is rising, falling, or moving sideways
- Whether the trend has been broken
- Whether the price is approaching key trend support or resistance
Horizontal Lines
Horizontal lines are useful for marking important price levels.
For example, if the price repeatedly fails to break above a certain level, it can be marked as resistance. If the price repeatedly rebounds from a certain level, it can be marked as support.
Useful for observing:
- Support levels
- Resistance levels
- Breakout levels
- Retest areas
Fibonacci Retracement
Fibonacci Retracement is often used to observe potential pullback areas after an upward or downward move.
For example, after the price rises from a low to a high, users can use the Fib Retracement tool by drawing from the low to the high and observing common retracement levels such as 0.382, 0.5, and 0.618.
Useful for observing:
- Whether the pullback is approaching key levels
- Whether the trend remains healthy
- Potential support or resistance areas
How to Find the Technical Indicator Library
In addition to drawing tools, SuperEx charts also provide access to technical indicators.
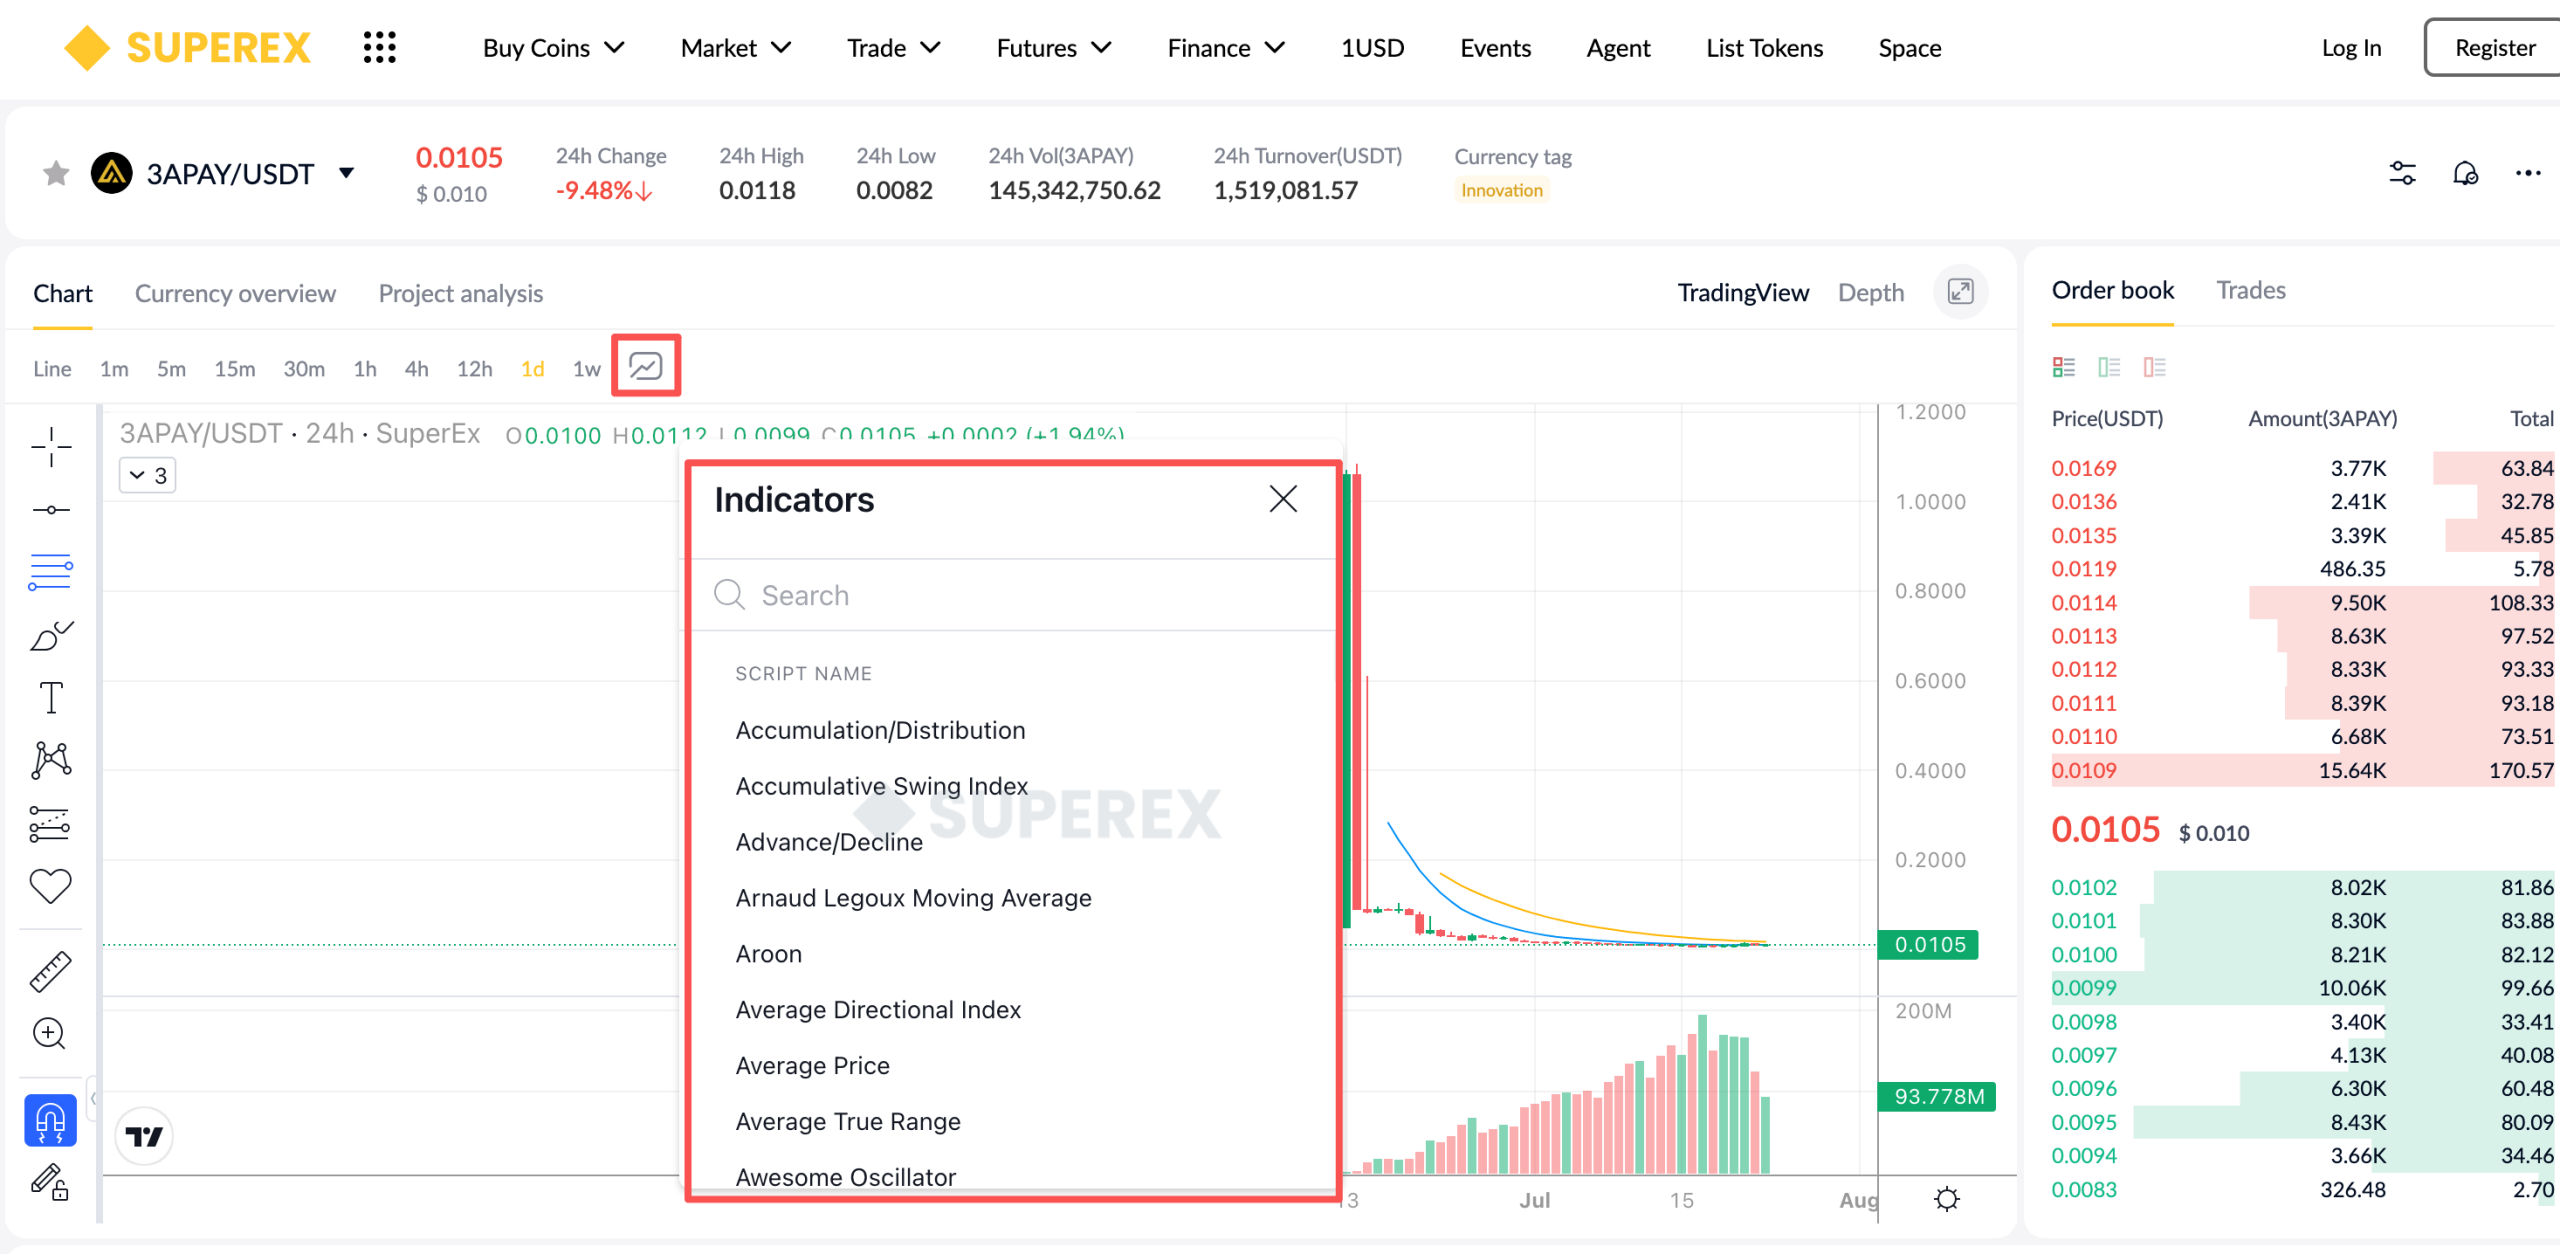
Above the candlestick chart, users can see timeframe options such as 1m, 5m, 15m, 1h, 4h, 1d, and 1w. Near these timeframe options, there is an icon similar to a “small chart / indicator” icon. Click it to enter the technical indicator library.
In the technical indicator library, users can search for and add common indicators, such as:
- MA / Moving Average: moving average line
- EMA: exponential moving average
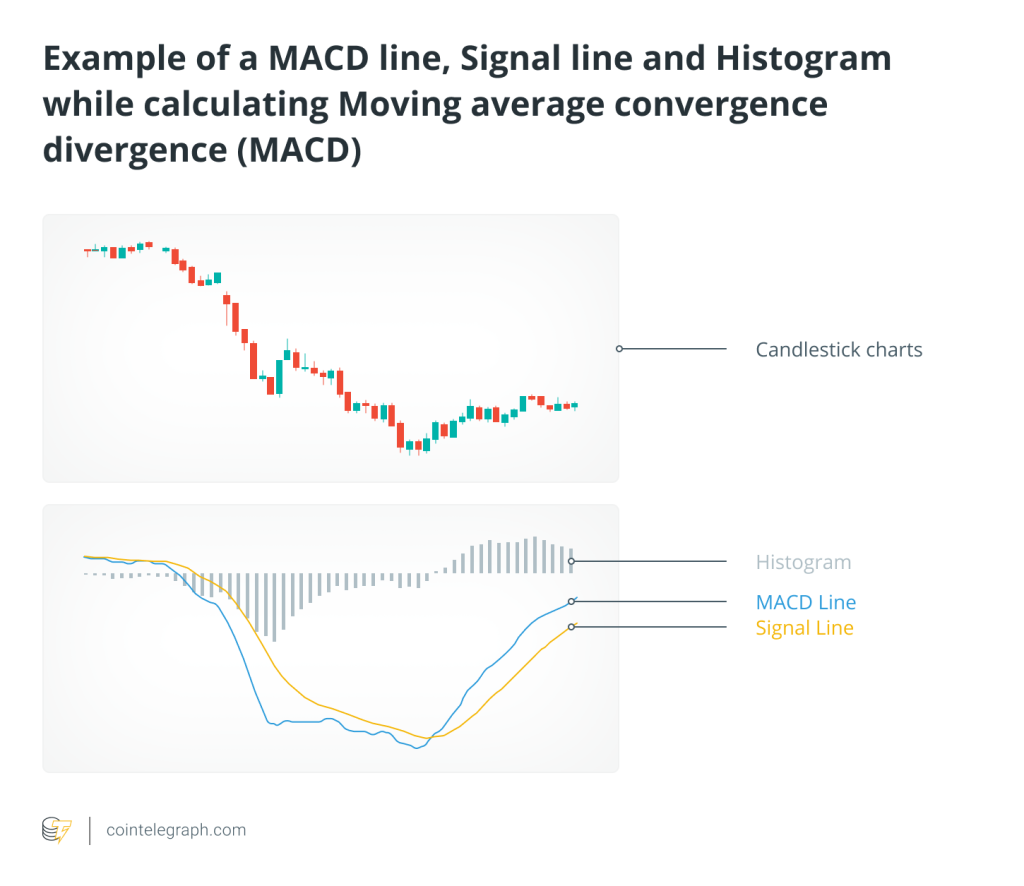
- MACD: trend and momentum indicator
- RSI: relative strength index
- Bollinger Bands: volatility bands
- Volume: trading volume
- KDJ: short-term fluctuation indicator
How to Use Common Technical Indicators
Different indicators are suitable for observing different dimensions of the market, and users can combine them based on their own trading habits.
- MA / EMA: observe trend direction and judge whether the price is above or below the moving average
- MACD: observe changes in trend momentum and help judge market strength
- RSI: observe whether the market may be overbought or oversold
- Bollinger Bands: observe price fluctuation ranges and abnormal breakouts
- Volume: observe whether price movements are supported by trading volume
It is important to note that technical indicators are not prediction tools, nor do they guarantee profits. A more reasonable approach is to use indicators as supporting references for market analysis.
How to Combine Chart Tools and Technical Indicators
For ordinary users, a simple analysis process can be used:
- First use timeframes to judge the broader direction
- Then use trend lines to observe price structure
- Use horizontal lines to mark support and resistance
- Use Fibonacci tools to observe pullback areas
- Finally, use indicators such as MACD, RSI, and MA for confirmation
For example:
- The trend line shows that the price is still in an upward channel
- The horizontal line shows that the price is approaching a key support level
- RSI has not entered a clear overbought zone
- MACD momentum has not weakened significantly
In this way, users can build a more complete market view instead of making decisions based only on a single candlestick.
Final Thoughts
The candlestick chart tools and technical indicator library provided by SuperEx are not designed to make trading more complicated, but to help users observe the market more clearly.
For beginners, these tools can help you understand trends, support, resistance, and pullbacks. For more advanced users, they can help build a more systematic trading analysis framework.
Trading should not rely only on emotion, nor should orders be placed purely by instinct. Learning to use chart tools and technical indicators is the first step from simply “watching the market” to truly “analyzing the market.”
Risk Warning: Technical analysis tools and indicators are for reference only and do not guarantee trading results. Cryptocurrency trading involves risk. Please trade rationally based on your own risk tolerance.


Responses