LEARN NEGATIVE VOLUME INDEX (NVI) INDEX IN 3 MINUTES ——BLOCKCHAIN 101
SuperEx Academy is the world’s first online academy to offer comprehensive education on crypto-native indicators. It features the most extensive technical indicator tutorials and is the most detailed online learning platform for market technical analysis. Here, you’ll find hundreds of courses on commonly used indicators, along with nearly every known crypto-native indicator tutorial.
Today, we will learn about the Negative Volume Index (NVI), a technical indicator. The Negative Volume Index (NVI) is a momentum indicator that focuses on days when trading volume decreases compared to the previous day. It’s based on the idea that smart money (institutional investors, insiders) tends to act quietly on low-volume days, while the crowd dominates on high-volume days.
So basically: NVI = a tool to track what the smart money might be doing behind the scenes.
- Click to register SuperEx
- Click to download the SuperEx APP
- Click to enter SuperEx CMC
- Click to enter SuperEx DAO Academy — Space
How NVI Is Calculated
NVI only changes when volume decreases. Here’s the formula:
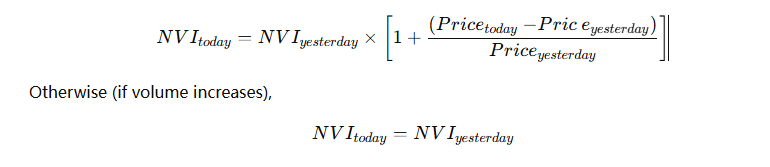
In simple terms:
- If today’s volume < yesterday’s volume, NVI moves in the same direction as price.
- If today’s volume > yesterday’s volume, NVI stays the same.
Most traders set the starting point at 1000, and then plot a moving average (often a 255-day MA) to identify trends.
How to Read the Negative Volume Index (NVI) — Deep Dive
The Negative Volume Index (NVI) doesn’t just show trend direction — it helps traders understand who’s participating in the market and how sustainable a move really is. When interpreted correctly, it can reveal whether a rally has real institutional support or if it’s just another retail-driven bubble waiting to burst.
Let’s break this down in detail:
When NVI Crosses Above Its Moving Average — The “Quiet Bull” Signal
When the NVI line crosses above its long-term moving average (most traders use 255 days or 200 days), it indicates that on low-volume days, prices are still rising. This is a subtle but powerful sign — it means that while the market appears “quiet,” informed players are slowly accumulating.
Think of this as a stealth uptrend, often occurring before the broader market notices.
1)Interpretation:
- Price and NVI both rising = accumulation by long-term investors.
- Volume is declining = the crowd isn’t active yet.
- Smart money is positioning for the next big move.
2)Crypto Example:
Let’s say Bitcoin’s price holds steady around $100,000, trading volume gradually decreases, and the NVI starts creeping upward. This typically means whales and funds are entering quietly, accumulating BTC without triggering large public attention.
You might not see this reflected in social sentiment or trending topics — but it’s often the first spark before a macro breakout. Historically, many bull markets start with a rising NVI weeks before price explosions happen.
3)Trading Insight:
When NVI crosses above its moving average after a prolonged bear phase, it’s often one of the earliest confirmation signals that the trend is shifting from distribution to accumulation. In these cases, traders often start building long positions or tightening short exposure, anticipating momentum acceleration.
When NVI Crosses Below Its Moving Average — The “Smart Exit” Warning
On the flip side, when NVI drops below its moving average, it’s a warning flag that smart money may be exiting — even if prices still look stable on the surface. This can happen when:
- Volume is low.
- Prices begin to stagnate or drift down.
- Retail traders remain optimistic (social media hype still strong).
It’s the classic “distribution phase” — the quiet offloading of positions before a more visible correction begins.
1)Interpretation:
- Declining NVI + flat price = silent distribution.
- Sharp drop in NVI = confidence weakening among institutional players.
- Volume spikes afterward often mark the retail panic phase.
2)Crypto Example:
Imagine Ethereum has rallied for months, but then the NVI begins to roll over and fall below its 255-day MA, even as ETH/USD continues climbing. That’s a sign the rally might be running on fumes. The pros are already scaling out while retail momentum chases the last leg.
This pattern appeared in several 2021 altcoin cycles — when coins reached euphoric highs, the NVI turned down first, weeks before the crash. The market looked strong, but smart money had already left the party.
3)Trading Insight:
When you see this setup, it’s time to be cautious:
- Tighten stop losses.
- Lock in partial profits.
- Avoid chasing new entries.
The NVI helps you exit before the crowd realizes something’s off.
Flat or Diverging NVI — The “Hidden Tension Zone”
Sometimes, NVI doesn’t trend up or down strongly — it moves sideways or diverges from price action. This situation often confuses traders but actually carries critical information about market psychology and structure.
Divergence 1: Price ↑ / NVI ↓
This scenario suggests a weak rally, primarily driven by retail enthusiasm or speculative FOMO. Smart money isn’t participating, and when that happens, the price move usually lacks long-term sustainability.
Example:
An altcoin surges 40% in a week due to social media hype, but NVI stays flat or even declines.That’s a warning sign — the rally may end abruptly once the hype fades.
Divergence 2: Price ↓ / NVI ↑
This is the opposite — a bullish divergence showing that while prices are dipping, the NVI is rising quietly.This often means informed traders are accumulating during fear, buying from panic sellers.
Example:
During a market correction, Bitcoin drops from $105,000 to $102,000, but NVI ticks up slightly — indicating subtle accumulation by those expecting a rebound. A few weeks later, BTC bounces back above $106,000, validating the signal.
The Role of Moving Averages in NVI Interpretation
Most traders don’t rely on NVI alone. They use a long-term moving average (like 255-day or 100-day) to smooth out noise. This acts as a filter — distinguishing temporary fluctuations from genuine institutional shifts.
For instance:
- If NVI > MA and both slope upward → trend confirmation.
- If NVI < MA but price still climbs → potential fake rally.
- If both flatten → consolidation or neutral phase.
This helps you avoid reacting to every wiggle on the chart and focus on macro structural changes.
Layering NVI with Other Tools
To increase accuracy, traders often combine NVI with:
- On-Balance Volume (OBV): to verify total volume flow direction.
- Positive Volume Index (PVI): to contrast crowd vs. smart money activity.
- RSI or MACD: to gauge momentum and confirm divergence strength.
When NVI and OBV both point in the same direction, the signal’s reliability rises sharply.
Psychological Perspective — Why NVI Works
NVI’s logic is rooted in market behavior:
- On high-volume days, everyone’s watching — moves are emotional.
- On low-volume days, only confident, well-informed investors act.
Thus, tracking what happens when the market is quiet often reveals the truth about sentiment. It’s like observing footprints in the sand when the tide is low — the crowd may have left, but the professionals’ tracks remain.
In the blockchain ecosystem — where volume data is public, transparent, and 24/7 — the NVI is even more insightful. You can apply it not just to exchange volume but also to on-chain transaction counts or wallet flow metrics.
For example:
- A rising NVI on Ethereum Layer 2 tokens might hint that developers or DAOs are accumulating before ecosystem upgrades.
- A falling NVI on memecoins amid hype usually predicts a fast blow-off top.
Final Takeaway
The Negative Volume Index isn’t a “trendy” indicator — it’s a smart money radar. It helps you see what most traders miss: the invisible accumulation and distribution cycles that define real market turns.
So next time you look at a chart, don’t just ask “What’s the price doing?”Ask — “What’s the price doing when no one else is watching?”
That’s where the NVI whispers the truth.
Summary (TL;DR)
- NVI = smart money’s footprint on low-volume days.
- Rising NVI → accumulation by insiders.
- Falling NVI → quiet distribution.
- Works best when used with PVI and moving averages.
- Especially powerful in crypto markets, where noise and retail emotion dominate.


Responses