LEARN LIVELINESS L INDEX IN 3 MINUTES ——BLOCKCHAIN 101

In the complex world of cryptocurrency investing, understanding market sentiment and the behavior of long-term holders can give you a decisive edge. One such on-chain metric that reveals these insights is the Liveliness Index. In just 3 minutes, you’ll get a clear grasp of what Liveliness is, how to interpret it, and why it matters for your trading and investment decisions.
What is the Liveliness Index?
Liveliness is a blockchain on-chain indicator that measures the ratio between the coin days destroyed and the coin days created within a given period. In simple terms, it captures how actively coins that have been held for a long time are being moved or spent.
- Coin Days Createdrefers to the accumulation of “coin days” — coins multiplied by the number of days they remain unspent.
- Coin Days Destroyedcounts how many coin days are “used up” when those coins move.
A high Liveliness value means many old coins are being spent or transferred, signaling increased activity from long-term holders. Conversely, a low Liveliness means most coins remain dormant, indicating strong holding behavior.
What Can Liveliness Show?
Liveliness is more than just a simple on-chain metric; it actually reflects the behavior and confidence of one of the market’s most important groups — the long-term holders (HODLers). Understanding this can help you better time market cycles and make smarter investment decisions.
1. Identifying Bull and Bear Market Transitions
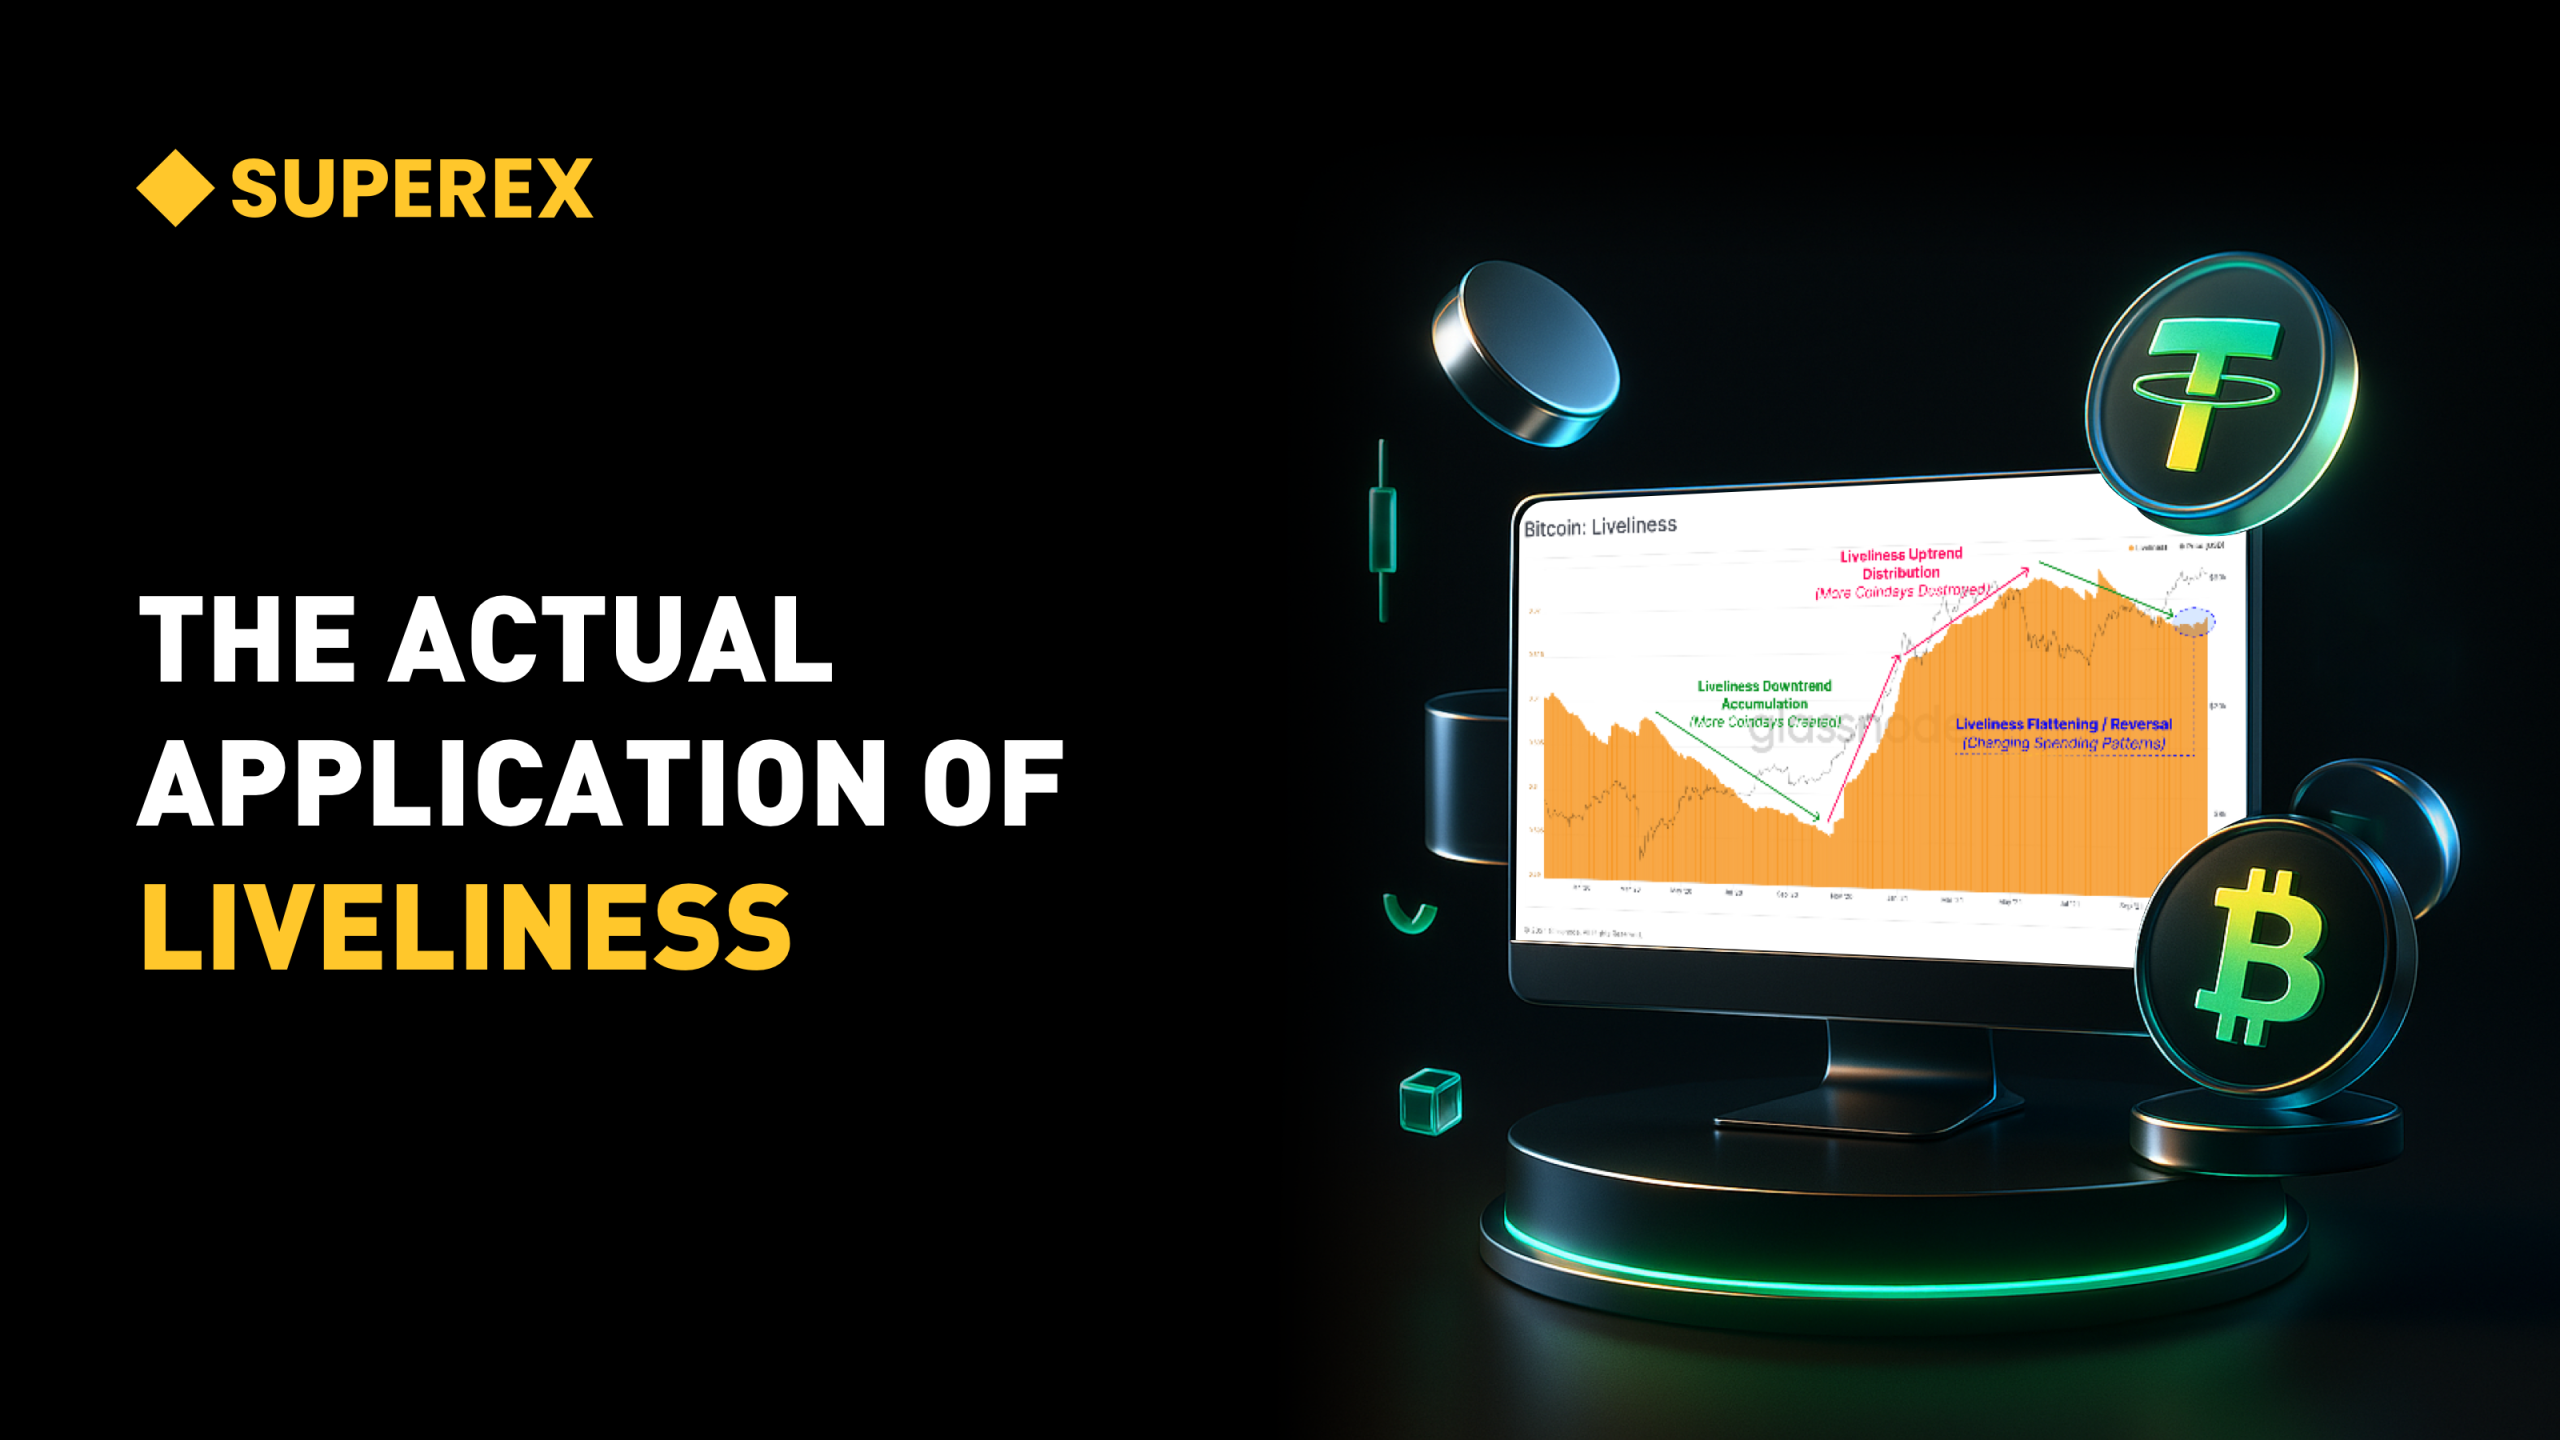
Liveliness holds significant value in identifying transitions between bull and bear markets. At the peak of a bull market, prices soar, attracting many short-term speculators and prompting long-term holders to take profits by selling their coins. This results in many “old coins” being moved or spent, causing a sharp rise in the Liveliness index. In other words, a high Liveliness signals strong selling pressure and increasing market risk.
During bear markets, especially near market bottoms, Liveliness typically declines. This means long-term holders are holding steady or even accumulating, resisting panic selling. Low Liveliness reflects strong conviction among core holders and can indicate that the bear market might be approaching its end.
Historical data shows that many Bitcoin price tops have coincided with rapid Liveliness increases, while bottoms tend to align with sustained low levels. For example, the December 2017 Bitcoin peak featured a sudden Liveliness spike as long-term holders realized profits, whereas during the 2018-2019 bear market, Liveliness remained low as long-term holders held firm.
2. Revealing Market Sentiment and Capital Flow
Liveliness serves as a thermometer of market sentiment and capital flow. When prices fall to low levels but Liveliness stays low or even declines further, it signals that core holders maintain strong faith and are not shaken by short-term price swings. This silent confidence is often a precursor to market recovery.
Conversely, in times of extreme pessimism, Liveliness may temporarily increase due to heightened selling pressure, even among long-term holders, signaling panic selling or market capitulation. This often marks the trough of market cycles or a period of intense shakeout.
By tracking Liveliness, investors gain insight into “who is buying and who is selling,” especially regarding long-term capital movements. It reveals psychological shifts and chip (token) flows that are invisible in price charts alone, helping investors avoid being misled by short-term noise.
3. Assisting Mid-to-Long-Term Positioning
Though not a short-term indicator, Liveliness is valuable for mid-to-long-term investment strategies. It helps investors identify potential support and resistance zones, and avoid chasing overheated markets or panic selling at bottoms.
When Liveliness rises steadily while prices remain range-bound, it indicates profit-taking by long-term holders and increasing market risk. Conversely, a consistent decline in Liveliness signals accumulation and stability provided by long-term holders, boosting market confidence.
Combined with other on-chain metrics like HODL Waves, SOPR, and MVRV, Liveliness becomes a key tool for building a margin of safety and crafting better entry and exit strategies.
4. Monitoring Market Emotion and Risk Levels
Market sentiment is a major driver of price volatility. Liveliness reflects the “fear and confidence” levels of market participants.
At the start of a bull market, Liveliness gradually rises with growing activity, indicating more long-term coins are being spent and short-term trading heats up. At the bull market’s peak, Liveliness often hits its highest levels, warning investors of potential tops.
During bear markets, Liveliness falls as market emotion cools, but this signals a “quiet strength” with long-term holders maintaining positions and preparing for the next cycle.
Ultimately, Liveliness helps investors sense the true direction of market sentiment, recognize when the market is vulnerable to corrections, and identify when it is resilient and ready to rally.
How to Use Liveliness in Trading?
Now that you understand what Liveliness measures and what it reveals, here are practical tips on using it:
- Watch for spikes:Sudden increases in Liveliness often signal large-scale selling by long-term holders, which can precede price corrections.
- Look for lows:Sustained low Liveliness can indicate strong conviction and accumulation by core holders, often a bullish sign.
- Combine with volume and price action:Liveliness alone isn’t a silver bullet but works well alongside other technical and on-chain indicators.
- Set alerts around key levels:Historical Liveliness levels tied to past market tops and bottoms can guide your risk management.
Practical Examples: Using Liveliness in BTC Market from 2021 to 2023
Case 1: Early Warning Signal at the 2021 Top
When BTC was fluctuating above $60,000, Liveliness showed a clear turning point and began to rise rapidly. Although the price did not immediately crash, the large amount of old coins being spent indicated that major holders were withdrawing. This eventually led to the sharp price drop a few weeks later.
Case 2: Bottom Formation Signal at the End of 2022
When BTC dropped below $16,000, Liveliness lingered at a low level for an extended period, indicating that long-term holders were not panic-selling but choosing to hold or add positions. This signal later proved to be a precursor to the rebound in 2023.
Advantages vs. Limitations of Liveliness
Advantages:
- Strong Resistance to Manipulation:Liveliness is derived from on-chain data, making it immune to artificial manipulation. Compared to candlestick charts or trading volume, it is more reliable.
- Intuitive Reflection of Holder Sentiment:You can tell at a glance whether “early players” still believe in the market by looking at a single number.
- Sensitive to Market Tops:Since spending of old coins usually happens near the end of a bull market, top signals from Liveliness are very clear.
Limitations:
- Noticeable Lag:Changes in Liveliness lag behind price movements by about 1–2 weeks, so it is not suitable for high-frequency trading.
- Cannot Be Used Alone:It works best when combined with BTC price trends, on-chain transaction volumes, HODL Waves, SOPR, and other indicators for confirmation.
- Not Suitable for Short-Term Analysis:Analyzing 5-minute or hourly candlesticks with Liveliness is basically meaningless; it’s more appropriate for daily to monthly trend assessments.
Conclusion
The Liveliness Index is a powerful window into the behavior of long-term holders — arguably the most influential players in crypto markets. By understanding and monitoring this metric, you gain insight into the market’s underlying health, potential tops and bottoms, and the sentiment driving price action.
If you want to sharpen your crypto market intuition and make better-informed investment decisions, incorporating Liveliness into your analysis toolkit is a smart move.


Responses