LEARN MEDIAN PRICE INDEX IN 3 MINUTES – BLOCKCHAIN 101

In financial analysis and trading, price indicators are key tools for understanding market trends and making informed decisions. Among these, the Median Price Index stands out as a straightforward yet insightful tool, particularly for identifying trends and market stability. This article will delve into what the Median Price Index is, how to calculate it, its applications in trading strategies, and how it compares with other indicators.

What Is the Median Price Index?
The Median Price Index represents the average of the high and low prices of an asset within a given period. Unlike moving averages or weighted indices, it focuses solely on the high and low data points, offering a simplified view of market activity.
Formula:
Median Price=(High Price+Low Price)/2
For example, if a stock’s high is $100 and its low is $80 during a session, the median price for that session is:
Median Price=(100+80)/2=90
Key Characteristics of the Median Price Index
- Simplicity:It relies on easily accessible data—daily highs and lows—making it straightforward to calculate.
- Trend Identification:By plotting the median price over time, traders can visualize trends and identify key support and resistance levels.
- Noise Reduction:Since it uses two critical points (high and low), it reduces the impact of intraday noise, particularly beneficial in volatile markets.
Calculating the Median Price Index in Practice
Calculating the Median Price Index can be done manually or via charting platforms. Here’s a step-by-step approach:
- Identify the Data:Gather the high and low prices for the asset over the desired time frame (e.g., daily, weekly).
- Apply the Formula:Use the formula for each data point to calculate the median price.
- Plot the Values:On a price chart, plot the median prices as a line to visualize trends.
For instance, consider the following data for a week:

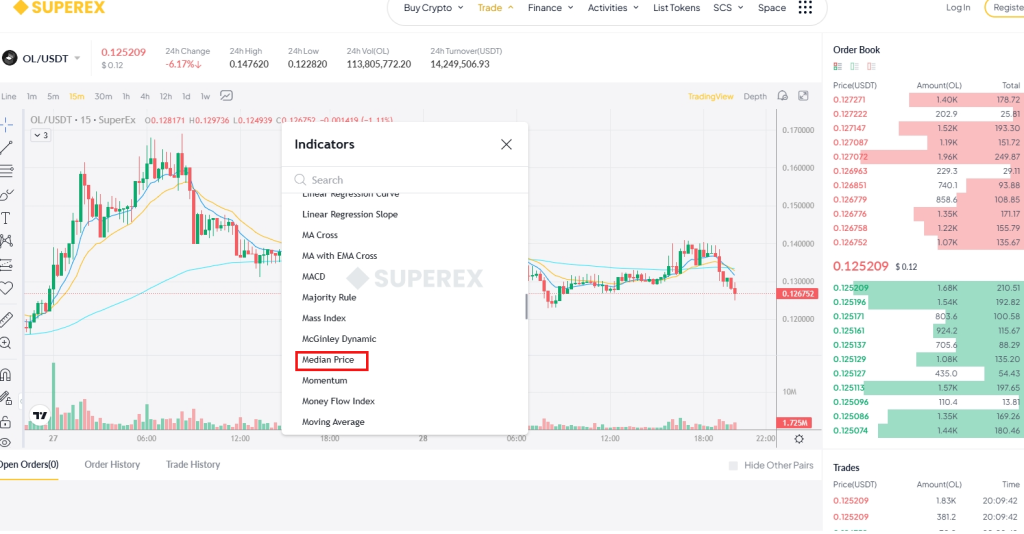
Certainly, on SuperEx, ready-made Median Price charts have already been provided for users.

Applications of the Median Price Index
a. Identifying Market Trends
A rising Median Price Index indicates an upward trend, while a declining one signals bearish momentum. For instance:
- If the median price consistently increases over weeks, it suggests bullish sentiment.
- Conversely, declining median prices highlight bearish tendencies.
b. Detecting Support and Resistance Levels
Median prices often cluster around key levels. Traders can use these clusters to predict future support (price floor) or resistance (price ceiling).
c. Smoothing Market Noise
For assets with volatile price movements, the Median Price Index smooths out anomalies, providing a clearer picture of the general trend.
d. Integration with Other Indicators
The Median Price Index can be combined with other indicators like the Moving Average or RSI (Relative Strength Index) to refine trading strategies:
- Median + RSI:Use the median price to confirm overbought/oversold signals from RSI.
- Median + Moving Average:Compare the median price with its moving average to identify potential reversals.
Median Price vs. Other Indicators

Real-World Examples: Using the Median Price Index
Case Study 1: Cryptocurrency Trading
In volatile markets like Bitcoin or Ethereum, the Median Price Index is useful for cutting through price swings and identifying long-term trends.
Example: If BTC’s daily high is $95,000 and its low is $90,000:
Median Price=(95,000+90,000)/2=92,500
By plotting median prices, traders can spot support/resistance zones and adjust their entries/exits accordingly.
Case Study 2: Stock Market Analysis
For stocks with high intraday volatility, such as Tesla or Nvidia, the Median Price Index helps stabilize trend analysis.
Challenges and Limitations
While the Median Price Index is simple and effective, it does have limitations:
- Lack of Volume Consideration:It doesn’t account for trading volume, which can impact price movements.
- Less Reactive:Compared to more complex indicators, it might lag behind in fast-moving markets.
- No Predictive Power:The Median Price Index reflects past performance and doesn’t inherently predict future price movements.
How to Incorporate the Median Price Index into Your Trading Strategy
To make the most of the Median Price Index:
- Combine with Volume Indicators:Use volume data to confirm trends identified by the Median Price Index.
- Analyze Over Multiple Time Frames:Short-term and long-term analyses provide a comprehensive view of market behavior.
- Backtest Your Strategy:Use historical data to test how well the Median Price Index aligns with your trading goals.
Conclusion: The Value of Simplicity in Trading
The Median Price Index is a versatile, easy-to-use tool for traders and analysts. By focusing on high and low prices, it offers a clear and concise view of market trends, making it particularly valuable in volatile markets. While it may not provide the depth of more advanced indicators, its simplicity and reliability make it a staple for both novice and experienced traders.
By integrating the Median Price Index with other technical tools and remaining mindful of its limitations, traders can build robust strategies that adapt to diverse market conditions.


Responses