LEARN MOVING AVERAGE ADAPTIVE INDEX IN 3 MINUTES – BLOCKCHAIN 101

In the dynamic world of trading, traders constantly seek tools that adapt to market conditions, helping to capture trends while minimizing false signals. One such tool that has gained popularity is the Moving Average Adaptive (MAA) indicator, a type of moving average designed to adjust based on market volatility. This makes it more responsive in trend-following strategies and helps traders make informed decisions during fluctuating markets.

What is the Moving Average Adaptive (MAA)?
The Moving Average Adaptive (MAA) indicator is a modified moving average that changes its sensitivity according to the volatility and trend strength of an asset’s price. Traditional moving averages, such as the Simple Moving Average (SMA) or the Exponential Moving Average (EMA), apply a fixed smoothing factor, regardless of market conditions. In contrast, the MAA dynamically adjusts its smoothing factor, becoming more sensitive during high-volatility periods and less sensitive during low-volatility phases.
Developed as a versatile alternative to static moving averages, the MAA helps to strike a balance between noise reduction and quick response to price movements. This adaptability is especially beneficial for identifying trend reversals and for use in markets where price trends are not consistent.
How is the MAA Calculated?
The Moving Average Adaptive indicator typically incorporates a volatility or price-based factor that influences its calculation. One common approach uses Wilder’s Directional Movement Index (DMI) or the Chande Momentum Oscillator (CMO) to adjust the smoothing factor.
The formula may vary depending on the type of adaptive moving average, but here’s a general idea:
Determine the base moving average: This could be an EMA, SMA, or another variant.
Calculate the adaptive factor: Based on a volatility or trend-strength metric, the adaptive factor will adjust the sensitivity of the moving average.
Apply the adaptive factor: This modifies the base moving average, making it more responsive in volatile markets and less responsive in stable markets.
The result is a moving average that reacts to market changes without overreacting to minor price fluctuations.
Benefits of the MAA Indicator
The MAA indicator offers several advantages over traditional moving averages:
Reduces Lag in Trending Markets: Traditional moving averages tend to lag in response to price movements, often providing delayed signals. By adapting to market volatility, MAA reduces this lag, allowing for quicker response times when a trend is confirmed.
Filters Out Noise in Choppy Markets: During periods of low volatility, the MAA reduces sensitivity, helping traders avoid whipsaws and false signals common in flat or sideways markets.
Improves Accuracy of Entry and Exit Points: By responding more effectively to market changes, the MAA helps traders time their entries and exits with greater precision. This can be especially useful in high-frequency trading or in markets where quick decisions are crucial.
Key Applications of MAA in Trading
The MAA indicator can be applied in various trading strategies, from trend-following to mean-reversion. Here are some common applications:
Trend-Following Strategy
MAA is particularly effective in trend-following strategies, where the goal is to capitalize on sustained price movements in a single direction. When the MAA turns upward, it indicates a potential uptrend, signaling a buy. Conversely, when the MAA slopes downward, it may signal a downtrend, prompting a sell.
Support and Resistance
Traders also use MAA to identify dynamic support and resistance levels. When the price is above the MAA line, the line may act as a support level, indicating potential buying points on price dips. When the price is below the MAA line, it can serve as a resistance level, suggesting possible selling points on price rises.
Crossover Signals
Like traditional moving averages, MAA can be paired with other moving averages to generate crossover signals. For instance, when a short-term MAA crosses above a long-term MAA, it can be interpreted as a buy signal. Conversely, a cross below suggests a sell signal. Crossovers provide confirmation of trend direction and momentum, especially when combined with other indicators.
Volatility Breakouts
Given that MAA adjusts to volatility, it’s useful in identifying breakout points. If the MAA suddenly shifts direction or increases in slope, it may signify an impending price breakout, providing an entry signal for traders aiming to catch major price movements.
Combining MAA with Other Indicators
While MAA is powerful on its own, it is often combined with other indicators to improve signal reliability and confirm trends:
Relative Strength Index (RSI): RSI is a momentum oscillator that measures the speed and change of price movements. When used alongside MAA, RSI can help confirm whether a trend reversal or continuation is likely.
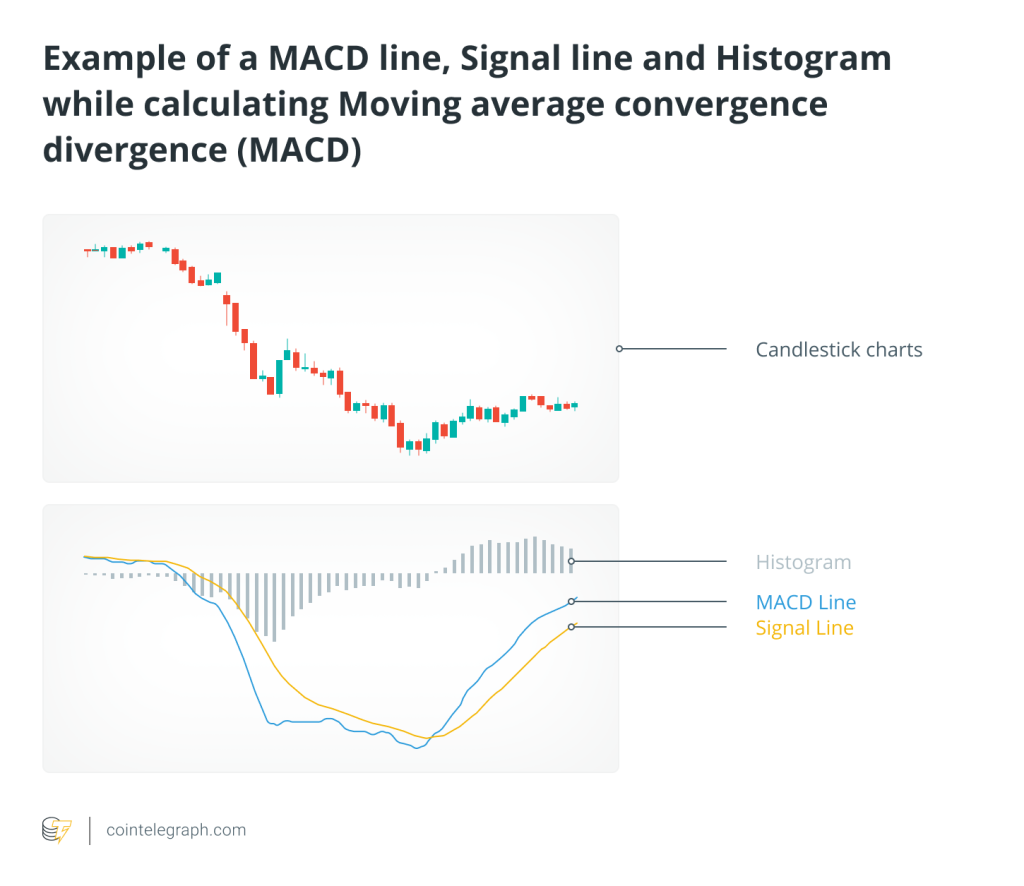
Moving Average Convergence Divergence (MACD): MACD is widely used for identifying potential buy and sell signals based on the crossover of moving averages. Pairing MACD with MAA can validate signals and reduce false alarms.
Bollinger Bands: These are volatility bands placed around a moving average. When combined with MAA, Bollinger Bands can signal high-volatility breakouts or reversals, offering insights into potential price targets.
Practical Example: Using MAA in a Trading Scenario
Imagine a trader is analyzing the BTC/USD chart with a 20-period MAA and a 50-period MAA. Here’s how they might interpret the signals:
Trend Identification: The 20-period MAA moves above the 50-period MAA, signaling the beginning of an uptrend. The trader enters a long position, expecting the price to rise.
Noise Filtering: During a period of low volatility, the MAA becomes less sensitive, reducing the likelihood of whipsaws. The trader holds their position, avoiding premature exits.
Exit Signal: When the 20-period MAA crosses back below the 50-period MAA, it signals a potential trend reversal. The trader closes their position, securing profits before a downturn.
Limitations and Considerations
While MAA is a versatile tool, it does have some limitations:
Lag in Extreme Market Conditions: Although MAA adapts to market changes, it may still lag in highly volatile markets, where price swings are sudden and sharp.
False Signals: In choppy or low-volume markets, MAA can still generate false signals, especially if used as a standalone indicator.
Complexity in Calculation: Unlike traditional moving averages, MAA is more complex to calculate and may require specialized charting software or programming knowledge.
Conclusion: Is MAA Right for You?
The Moving Average Adaptive indicator is an advanced tool that offers significant advantages for traders looking to stay ahead in ever-changing markets. By adapting to volatility, it provides a clearer perspective on price trends and can help improve the accuracy of entry and exit points. However, like any indicator, it should be used in conjunction with a comprehensive trading plan and additional indicators for confirmation.
For those ready to navigate its complexities, MAA opens doors to adaptive trading strategies, offering a way to harness the power of market momentum with greater precision. Whether you’re trading in high-volatility markets or seeking to filter out noise in calmer conditions, the MAA indicator can be a valuable addition to your toolkit.


Responses