LEARN VOLUME PROFILE VISIBLE RANGE INDEX IN 3 MINUTES – BLOCKCHAIN 101
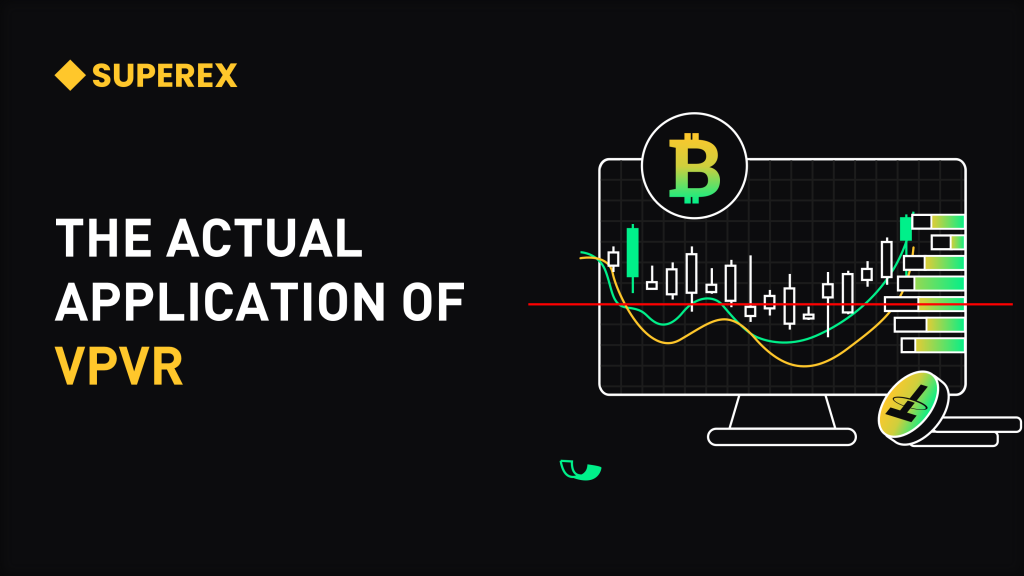
The Volume Profile Visible Range (VPVR) is a highly effective tool used in technical analysis to provide traders with a deeper understanding of market dynamics by visualizing the volume distribution across different price levels. Unlike traditional volume indicators that only display volume data along the x-axis (time axis), VPVR shows the cumulative volume at various price points on the y-axis, offering traders insights into where significant buying and selling activities have occurred.
In this article, we will dive deep into the structure of VPVR, its main components, common trading strategies, and how to implement this indicator effectively in various trading scenarios. By the end of this guide, you will have a clearer understanding of how to use VPVR to make more informed trading decisions.
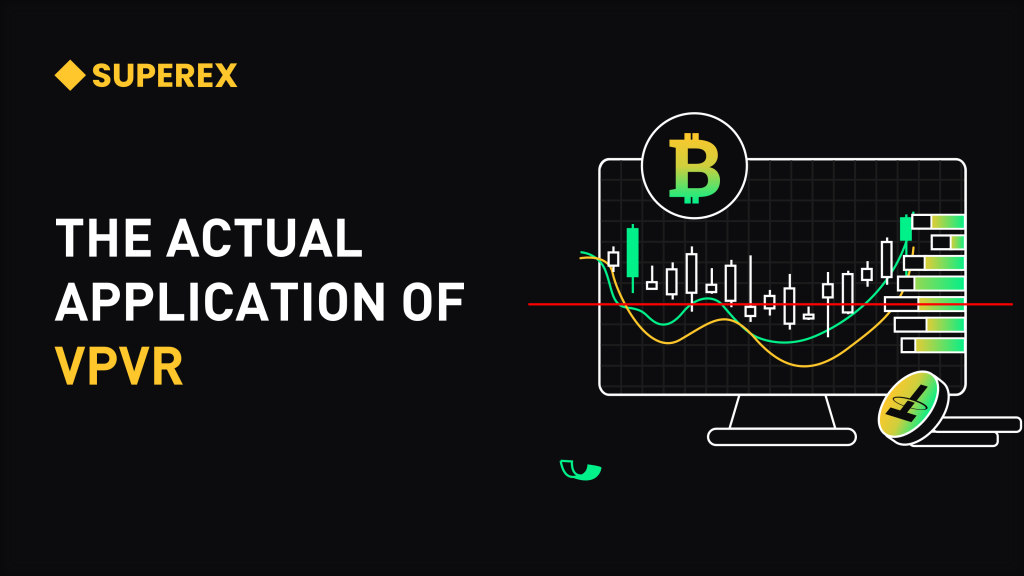
What is Volume Profile Visible Range (VPVR)?
The Volume Profile Visible Range (VPVR) is a technical indicator that presents a histogram-style chart, illustrating the volume traded at different price levels within a visible price range on the chart. This helps traders identify which price levels are experiencing the most activity and determine potential support and resistance zones.
Key Terminology:
- High Volume Nodes (HVNs): Price levels where the VPVR histogram bars are the longest, indicating areas with high trading activity. HVNs often act as support or resistance levels.
- Low Volume Nodes (LVNs): Price levels with shorter histogram bars, indicating low trading activity. Prices tend to move quickly through these areas due to low interest.
- Point of Control (POC): The price level where the highest trading volume occurred within the visible range, representing the most significant support or resistance level on the chart.
- Value Area: The range of prices where 70% to 80% of the total volume is concentrated. It indicates the most commonly traded price range, and is usually marked with upper and lower boundaries.
By observing these levels, traders can gain a better understanding of market sentiment and identify potential entry and exit points for trades.
How Does VPVR Work?
VPVR analyzes the price range visible on the trading chart and calculates the total volume traded at each price level within that range. The result is a side-by-side volume histogram that plots these values along the y-axis (price levels), rather than the x-axis (time).
The indicator breaks down the volume into buy and sell volumes, which can show the trader whether a specific price level is more favored by buyers or sellers. The longest bar in the histogram (POC) indicates the price level with the highest traded volume, while shorter bars signify price levels with less activity.
VPVR’s Key Components Explained
- Volume Bars: These bars are aligned along the price axis and show the cumulative trading volume at each price level. Longer bars represent higher trading volumes, while shorter bars indicate lower volumes.
- High Volume Nodes (HVNs): These are the areas where the longest bars are present. HVNs typically indicate areas of price consolidation, suggesting that market participants are finding consensus at these levels.
- Low Volume Nodes (LVNs): These areas have shorter bars, showing less activity. Prices tend to move quickly through LVNs, as there is minimal opposition to price movements, making them ideal areas for potential breakouts or breakdowns.
- Point of Control (POC): The POC is the price level with the highest traded volume within the visible range. It is often viewed as a fair value area for the asset, where buyers and sellers are most in agreement.
- Value Area: This is the price range where the majority of volume (typically 70% to 80%) was traded. The value area can be used to determine the most significant price levels and serves as a guide for setting potential support and resistance levels.
Trading Strategies Using VPVR
Strategy 1: Identify Support and Resistance Levels
One of the primary uses of VPVR is to identify potential support and resistance levels based on volume. The HVNs are indicative of strong support and resistance zones. For example, if the price approaches a high-volume node from below, it is likely to face resistance at that level. Similarly, if the price moves down to a high-volume node, it may find support and bounce back up.
Strategy 2: Trend Confirmation
The position of the POC and the distribution of HVNs and LVNs can help confirm the strength of a trend or signal potential reversals. If the POC is shifting upward over time, it suggests an uptrend with increasing buyer interest. Conversely, if the POC shifts downward, it indicates a downtrend. Traders can use this information to validate their trend-following strategies.
Strategy 3: Breakout and Reversal Trading
LVNs represent price levels with low trading volume, which suggests that these levels may not have significant resistance or support. As a result, prices can move swiftly through LVNs, making them excellent areas for breakout or breakdown trades. Traders can look for breakouts through LVNs to initiate positions, placing stop-loss orders near the boundaries of the value area.
Implementing VPVR in Your Trading Strategy
To implement VPVR in your trading strategy, follow these steps:
- Set Up the VPVR Indicator on Your Chart: Most advanced charting platforms like TradingView offer VPVR as a built-in indicator. Enable the indicator and adjust the settings to fit your preferred visible range.
- Analyze High and Low Volume Nodes: Identify key HVNs and LVNs within the visible range. Pay attention to where the price currently is relative to these nodes.
- Monitor Price Reactions at POC and Value Area Boundaries: Use these levels to set potential entry and exit points. If the price is moving toward a high-volume node, observe whether it finds support or resistance and plan your trades accordingly.
- Use Other Indicators for Confirmation: Combine VPVR with other technical indicators like moving averages or RSI to confirm trading signals and reduce false entries.
Conclusion
The Volume Profile Visible Range (VPVR) is a powerful tool that provides unique insights into market dynamics by highlighting the volume traded at different price levels. It helps traders identify key support and resistance zones, detect potential trend reversals, and make more informed trading decisions. By understanding how to interpret the VPVR’s key components—such as the POC, HVNs, and LVNs—traders can gain a significant edge in navigating complex markets.



Responses