Bitcoin analysts converge on a breakout in September — But is $86K possible?

Bitcoin could see a breakout to new all-time highs as soon as next month, but BTC must first tackle significant resistance around $59,500.

Bitcoin could see a breakout in September, based on historical chart patterns, and $86,000 could be the next major price target.
Bitcoin price set for breakout in September
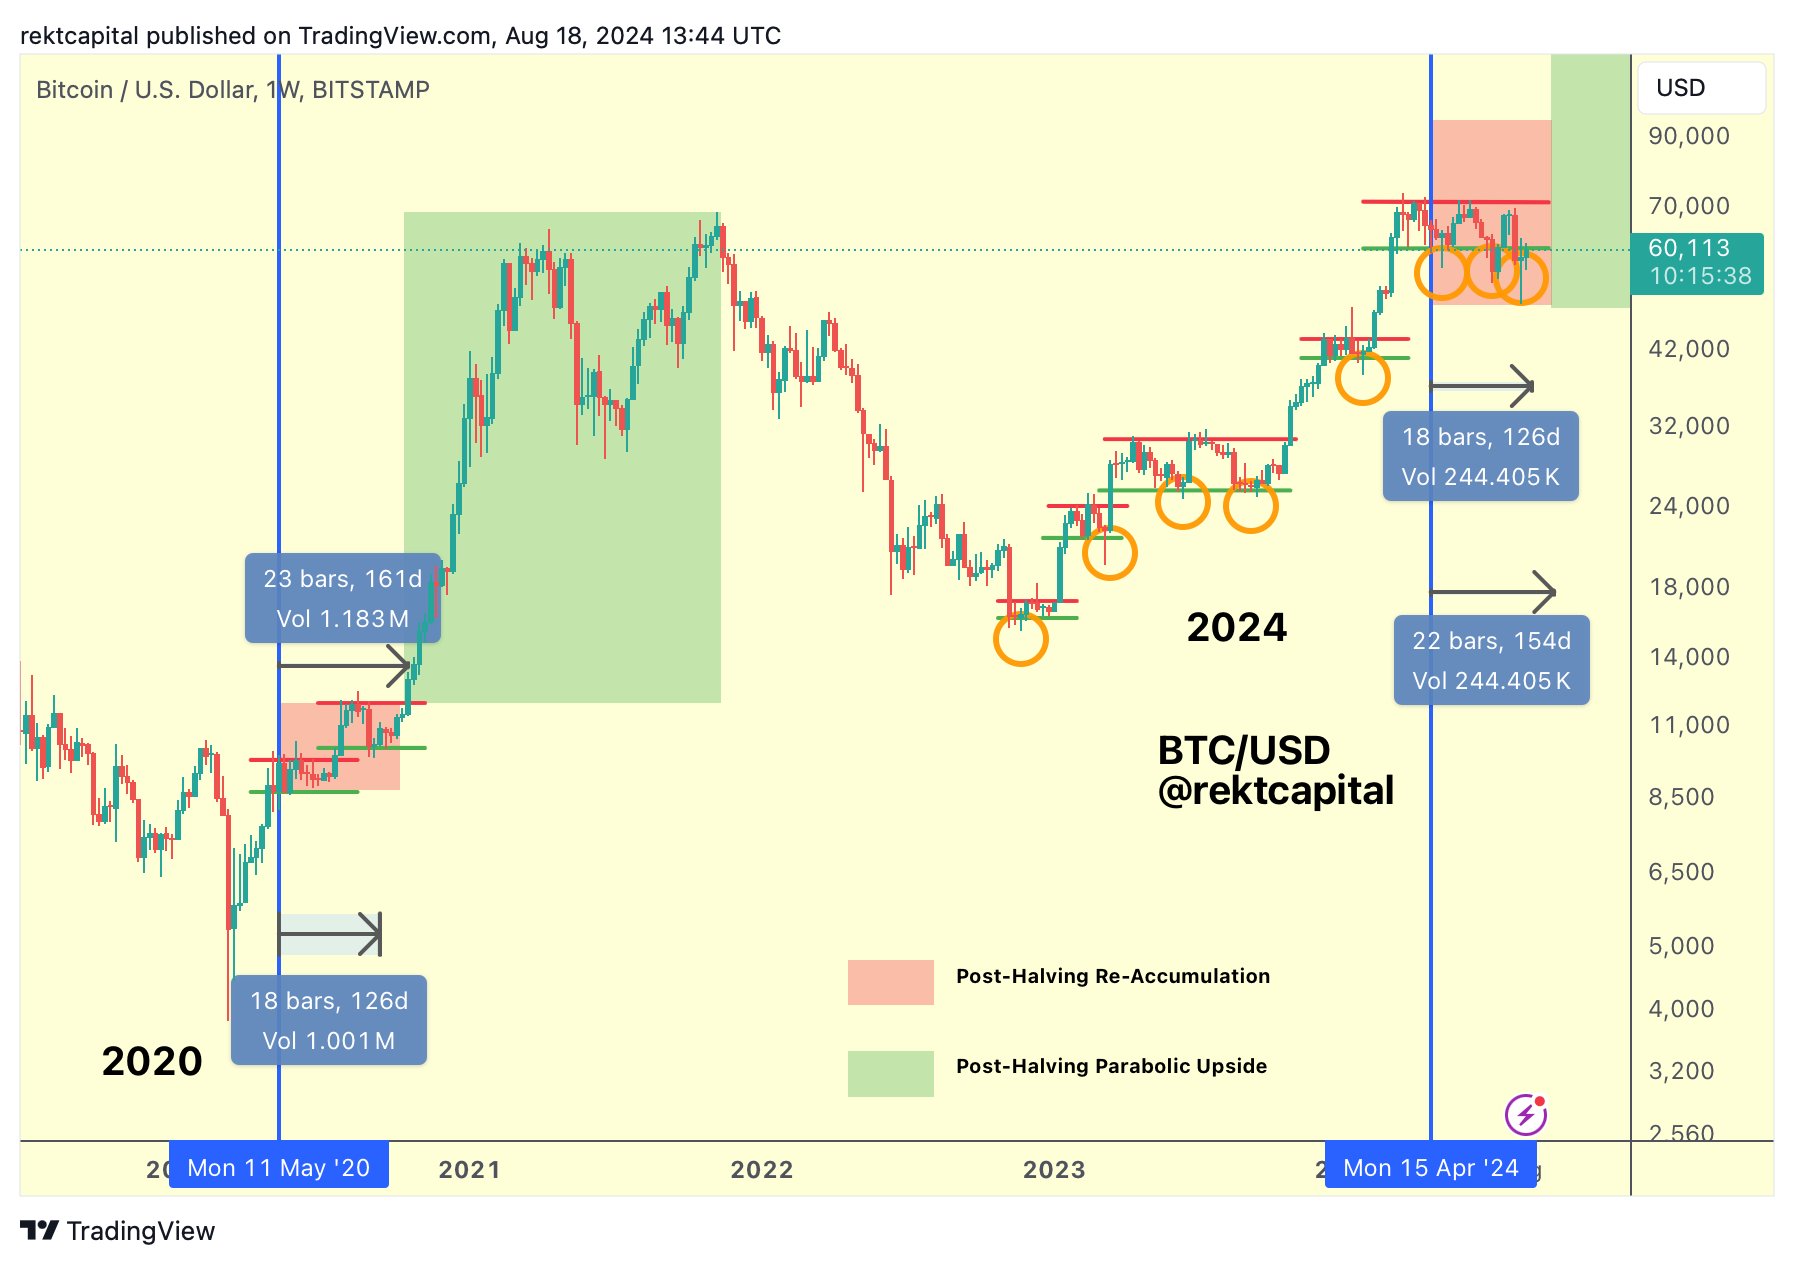
Bitcoin’s (BTC) price could be on track to an imminent breakout in September, based on previous post-halving chart patterns, according to popular analyst Rekt Capital.
The analyst wrote in an Aug. 18 X post to his 493,000 followers:
“Bitcoin tends to breakout into the Parabolic Phase of the cycle some ~160 days after the Halving. If history repeats, Bitcoin could be just over a month away from breakout. That’s late September.”
The macroeconomic outlook is also promising. Specifically, Bitcoin could be set for a breakout thanks to the growing global M2 money supply, according to Jamie Coutts, a chief crypto analyst at Real Vision.
Coutts wrote in an Aug. 13 X post:
“Over the past decade, Bitcoin has had a tendency to trough several months before the bottom in global M2. Then it rips, gets way ahead of the move in liquidity, and has a mid-cycle correction.”
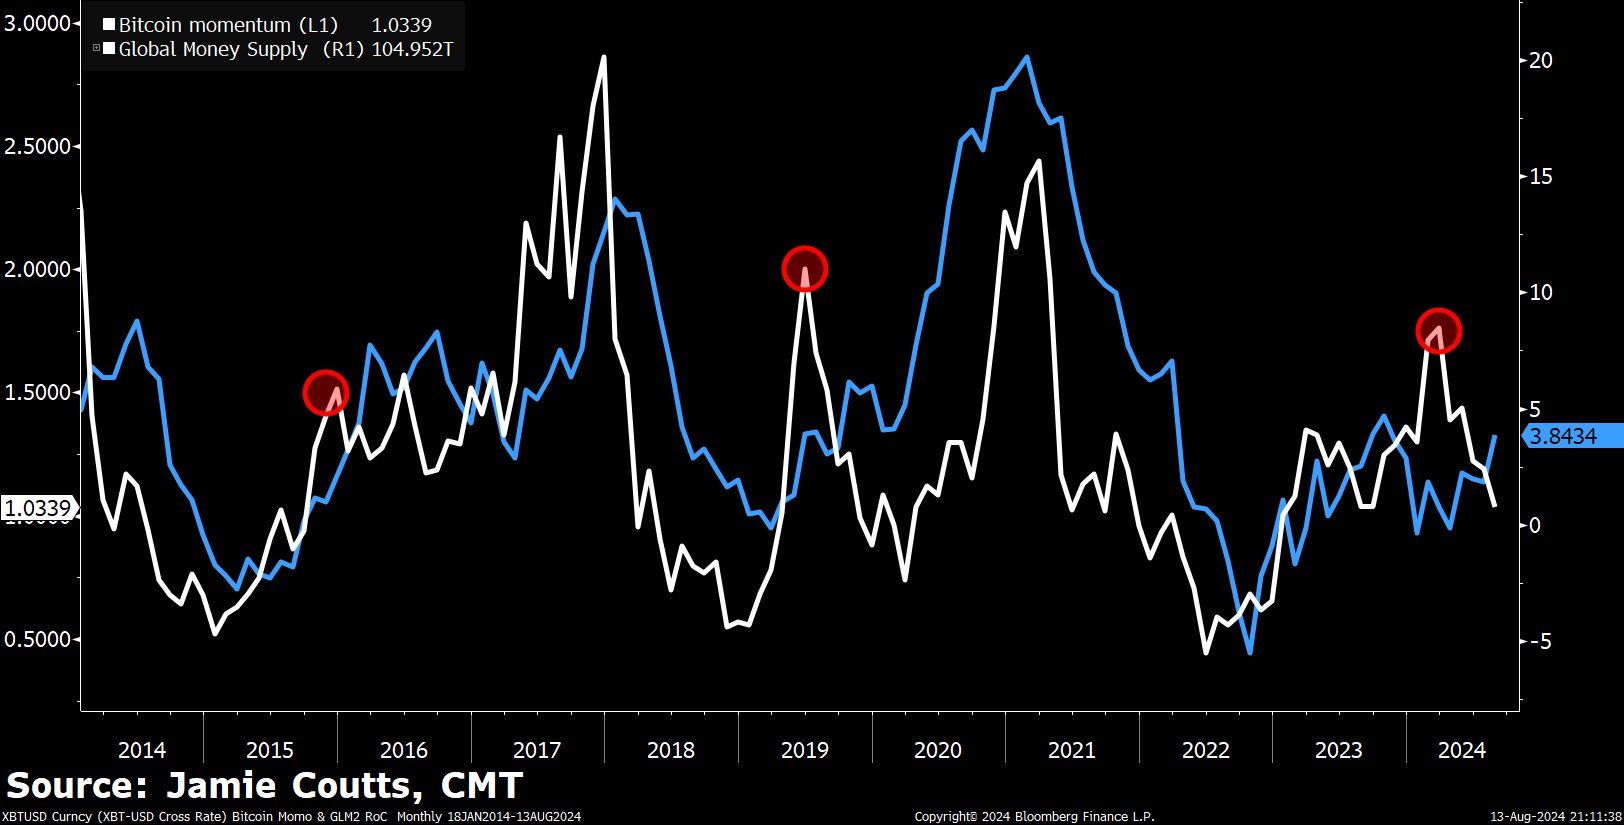
The analyst added that the growing global liquidity from the M2 money supply, combined with the spot Bitcoin exchange-traded funds (ETFs), makes for the “perfect setup” for Bitcoin.
Related: Ether’s price drop due to investor sentiment, not $420M ETF outflows: Nansen
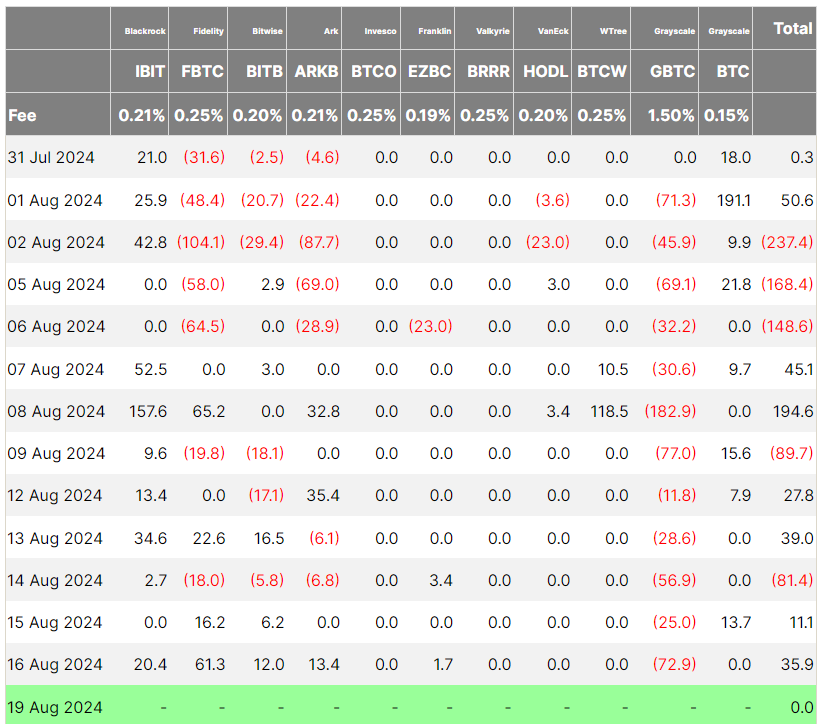
Additional tailwinds might also come from Bitcoin ETF inflows, which turned positive for two consecutive days last week, with positive net flows of $35.9 million on Aug. 16, according to Farside Investors data.
Last quarter, institutional Bitcoin ETF adoption grew by over 27%, with 262 new firms investing in spot Bitcoin ETFs.
“Megaphone” hints at $86,000
Bitcoin’s next major price target could be around $86,000 if it manages to break out in September, according to popular crypto analyst Titan of Crypto.
The analyst wrote in an Aug. 18 X post:
“Bitcoin Intermediate Target: $86,000. Would you bet on this Megaphone Pattern playing out?”
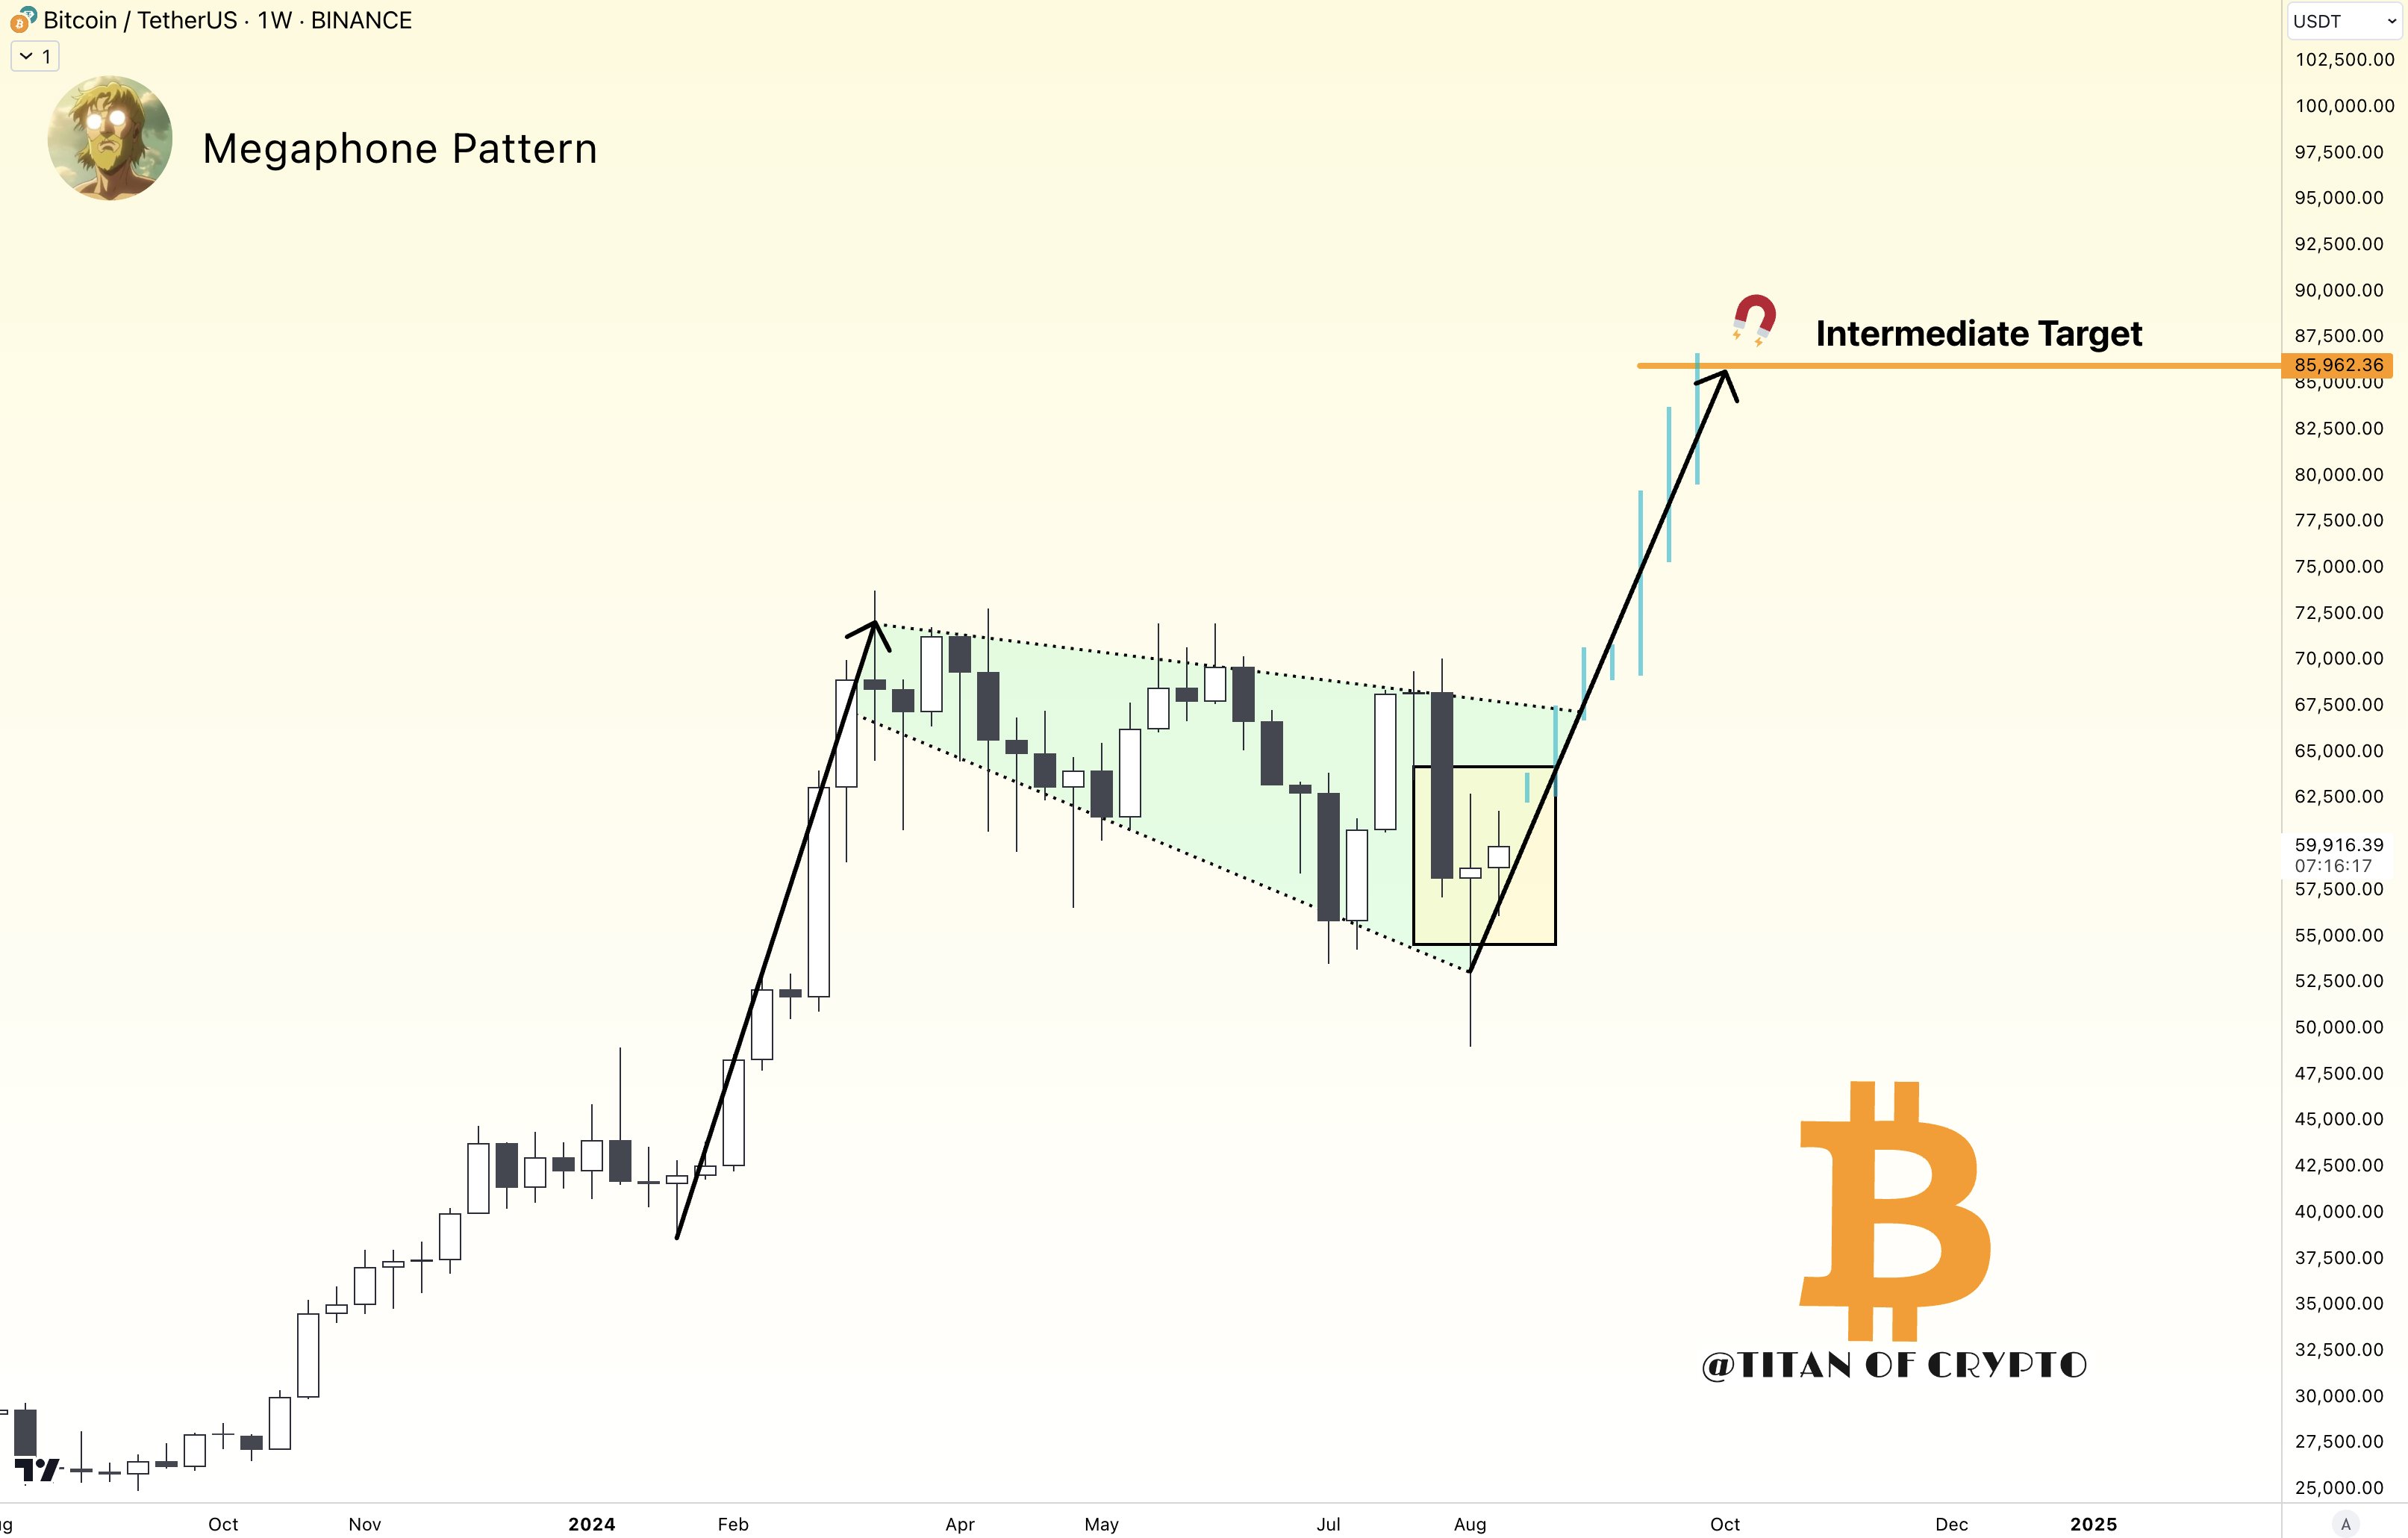
The megaphone technical chart pattern consists of at least two higher highs and two lower lows. It occurs when the market is highly volatile and marks either a macro top or macro bottom.
However, Bitcoin price failed to print a daily close above its current downtrend, which could mean lower lows in the short term, wrote Rekt Capital:
“The reality is that Bitcoin is going to keep downtrending until it breaks. But Bitcoin is only one Daily Close above the Downtrend from turning it all around.”
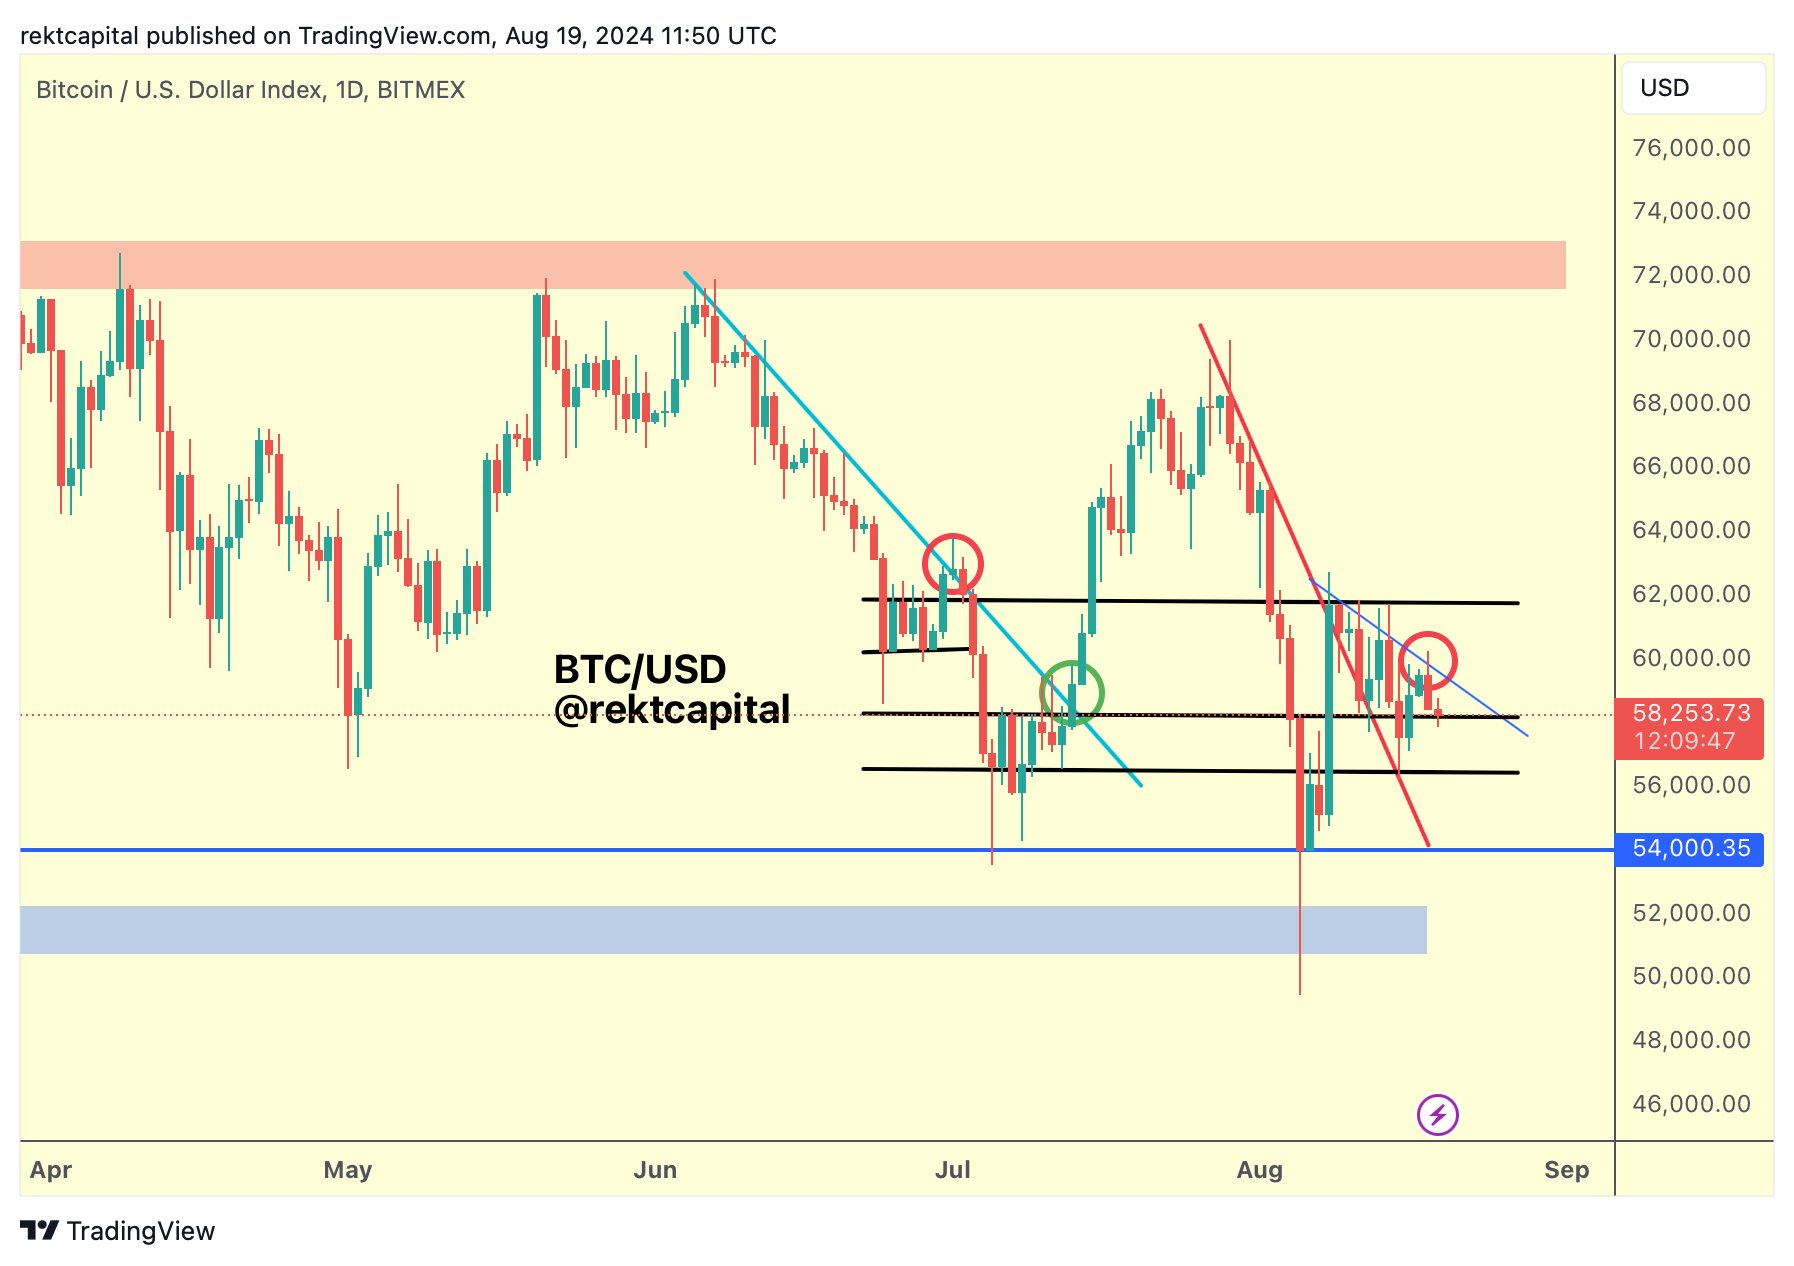
These “lower lows” might mean a retest of the $54,000 and $50,000 support levels before September.
Meanwhile, Bitcoin faces significant resistance at $59,500. A potential break above this level would liquidate over $800 million worth of cumulative leveraged short positions across all exchanges, according to Coinglass data.

Short Bitcoin liquidations would surpass $1 billion if Bitcoin staged a recovery above $59,900.
Related: Key Bitcoin bull signal flashes for first time in nearly 2 years, hinting at 2x price surge
This article does not contain investment advice or recommendations. Every investment and trading move involves risk, and readers should conduct their own research when making a decision.


Responses