LEARN MOVING AVERAGE CHANNEL(MAC) IN 3 MINUTES – BLOCKCHAIN 101

Moving Average Channel, or MAC for short, is a technical analysis tool that helps traders identify price trends and volatility ranges by plotting two moving averages to form a price channel, thus making more informed trading decisions.
In this article, we will explain in detail the principle of Moving Average Channel, the calculation method, the techniques of using it, and its practical application in cryptocurrency trading.
An Introduction to MOVING AVERAGE CHANNEL (MAC)
Historical Background
Moving averages have been widely used as a technical analysis tool since the early 1900s. Initially, technical analysts in the stock market used Simple Moving Average (SMA) to smooth out price fluctuations in order to identify market trends more clearly. As technical analysis evolved, more and more variations and combinations were introduced, one of which is the Moving Average Channel (MAC).
What is Moving Average Channel (MAC)
The Moving Average Channel is a technical analysis tool that identifies price trends and volatility ranges by plotting two moving averages on a price chart to form a channel. Typically, these two lines are short-period and long-period moving averages, and the distance between the upper and lower bars can be determined based on a fixed percentage or number of points.
Calculation of MAC
Calculating a moving average channel requires two steps: first, calculating the two moving averages, and second, plotting the price channel.
- Calculate the moving averages:
- Short-Term Moving Average (Short-Term Moving Average, STMA): A simple moving average (SMA) with a short period (e.g. 20 days) is generally used.
- Long-Term Moving Average (LTMA): generally use a long period (such as 50 days) of the simple moving average (SMA).
- Plotting price channels:
- Upper line: obtained by adding a fixed percentage or number of points to a short-period moving average.
- Lower line: obtained by subtracting a fixed percentage or number of points from a long period moving average.
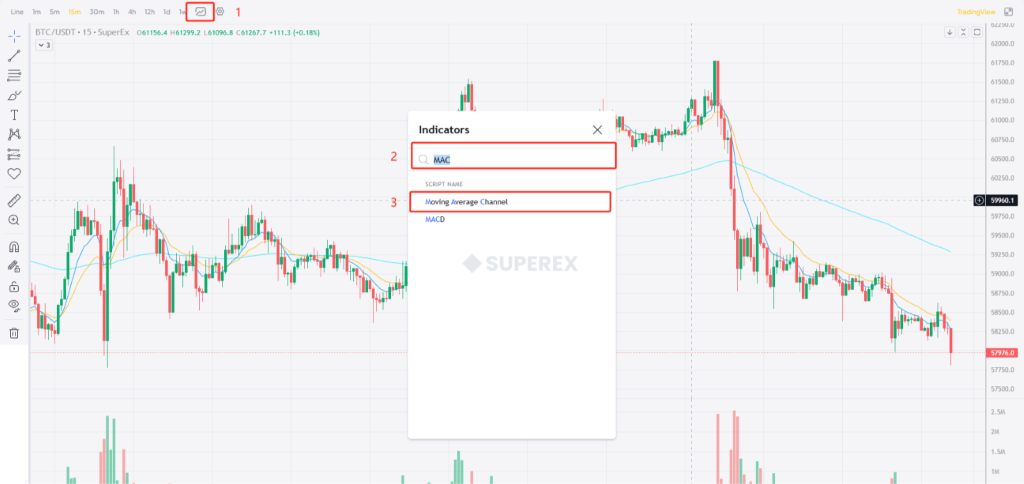
- Directly from the SuperEx Indicator Library
The SuperEx Indicator Library has MAC charts that can be applied directly in trading strategies to help users quickly complete the deployment of trading strategies in the steps shown below:
How to Interpret MAC
Trend Recognition:
- When prices are above the upper rail, the market is in a strong uptrend.
- When price is below the lower rail, the market is in a strong downtrend.
- When the price moves between the upper and lower rail lines, the market may be in a sideways consolidation.
Buy and sell signals:
- Buy Signal: When the price breaks above the upper line and continues to rise, it indicates a bullish market and traders may consider buying.
- Sell Signal: When the price falls below the lower rail and continues to fall, it indicates a bearish market and traders may consider selling.
Stop Loss and Take Profit:
- Stop Loss Point: When the price falls below the lower rail line, set a stop loss point to prevent bigger losses.
- Take Profit Point: When the price is close to the upper rail line, you can consider taking partial or full profit.
MAC in Cryptocurrency Trading
The cryptocurrency market is particularly useful for moving average channels in this market due to its high volatility. Below are some specific scenarios where MAC can be used in cryptocurrency trading:
Capturing trending quotes: with MAC, traders can identify trending quotes in cryptocurrencies so that they can follow the trend. For example, when the price of Bitcoin breaks above the upper rail line and continues to rise, it indicates that the market is in an uptrend and traders can consider buying and holding.
Recognize price pullbacks: In an uptrend, when the price approaches or breaks below the lower rail line, it may be a brief pullback where traders can look for buying opportunities to enter the market at a lower price.
Avoiding Oscillatory Markets: When the price fluctuates between the upper and lower rail lines, the market may be in an oscillatory market. At this point traders can choose to wait and see, avoiding frequent trades in a trendless market and reducing trading risk.
Practical Case Analysis
In order to better understand the application of MAC, let’s analyze it through a real-world case study. Suppose the daily chart of a cryptocurrency is as follows:
20-day SMA: short-period moving average
50-day SMA: Long-period moving average
Upper line: 20-day SMA + 2%
Lower line: 50-day SMA – 2%
By calculation, we plot the price channel. When the price breaks above the upper rail and continues to rise, the market is in an uptrend; when the price falls below the lower rail and continues to fall, the market is in a downtrend; when the price fluctuates between the upper and lower rails, the market is in a sideways consolidation.
Write in the last words
The Moving Average Channel (MAC), as a simple yet effective technical analysis tool, has important applications in cryptocurrency trading. Through in-depth understanding and flexible utilization of MAC, traders can better grasp the market trend and formulate more accurate trading strategies. However, in practice, traders should combine other technical indicators and do a good job of risk management to improve the success rate of trading.
We hope this article can help you better understand and apply the moving average channel and achieve better results in the cryptocurrency trading market.


Responses