Bitcoin metric calls 'local bottom' as traders eye sub-$60K BTC price
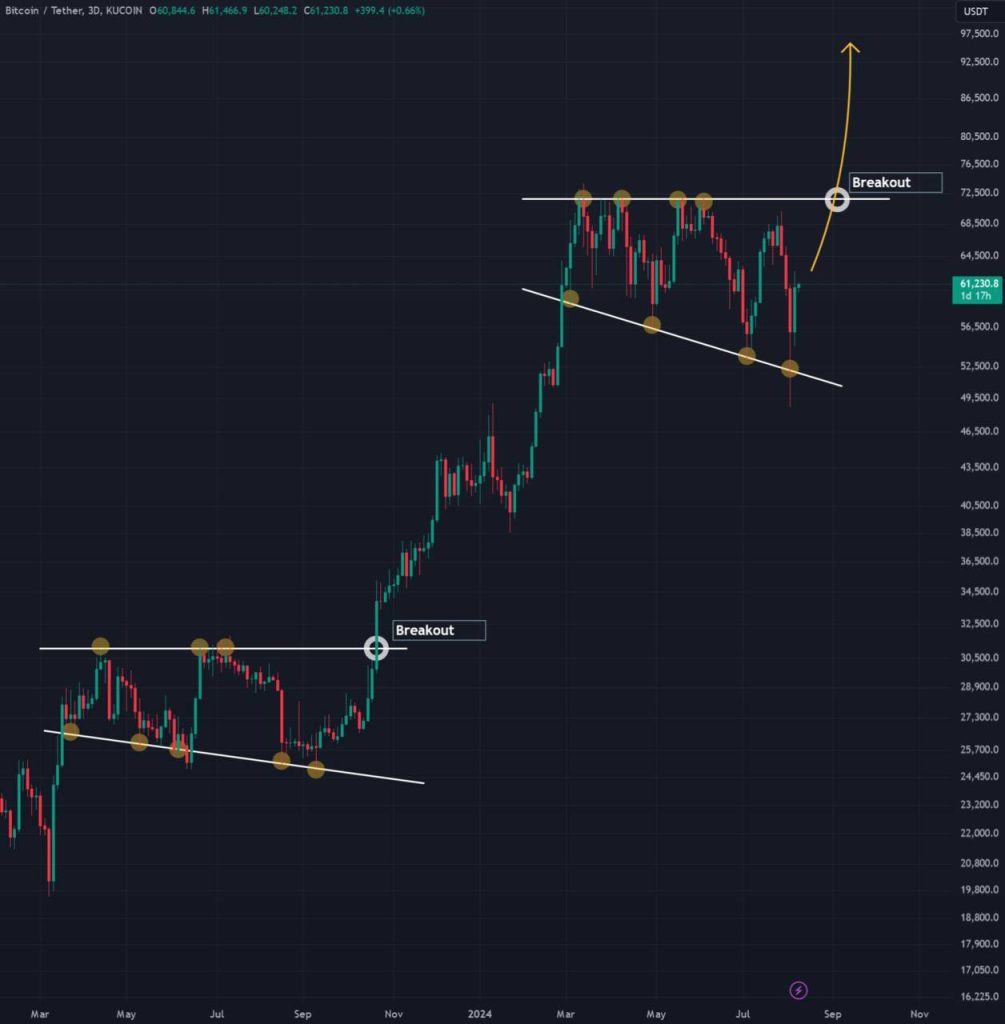
BTC price expectations demand a trip below $60,000 before upside continuation, but a market top and bottom metric says the worst is over.

Bitcoin (BTC) is signaling a third “local bottom” in 2024 as a leading BTC price metric sees room for growth.
Fresh research from onchain analytics platform CryptoQuant on Aug. 8 shows bullish moves from the network value to transaction golden cross (NVT-GC) tool.
BTC price “cooling down excessively
Bitcoin has fielded warnings of another breakdown on BTC/USD this week as moving averages produce a so-called “death cross.”
However, The longer-term picture is unclear, as other market indicators call for an enduring rebound.
Among them is NVT-GC, described by CryptoQuant as a volatility gauge similar to the Bollinger Bands.
NVT compares Bitcoin’s market cap to the value of transactions within a given timeframe, and the Golden Cross edition compares long-term and short-term NVT values.
The result is a rough guide to local market tops and bottoms, and in 2024, three such bottom signals have been produced.
“If the NVT GC rises above 2.2 points (red zone), it indicates that the price is overheating in the short-term trend and we are in a local top area,” CryptoQuant contributor Burakkesmeci explained in one of its Quicktake blog posts.
“On the other hand, if the NVT GC falls below -1.6 points (green zone), it indicates that the price is cooling down excessively and we are in a local bottom area.”
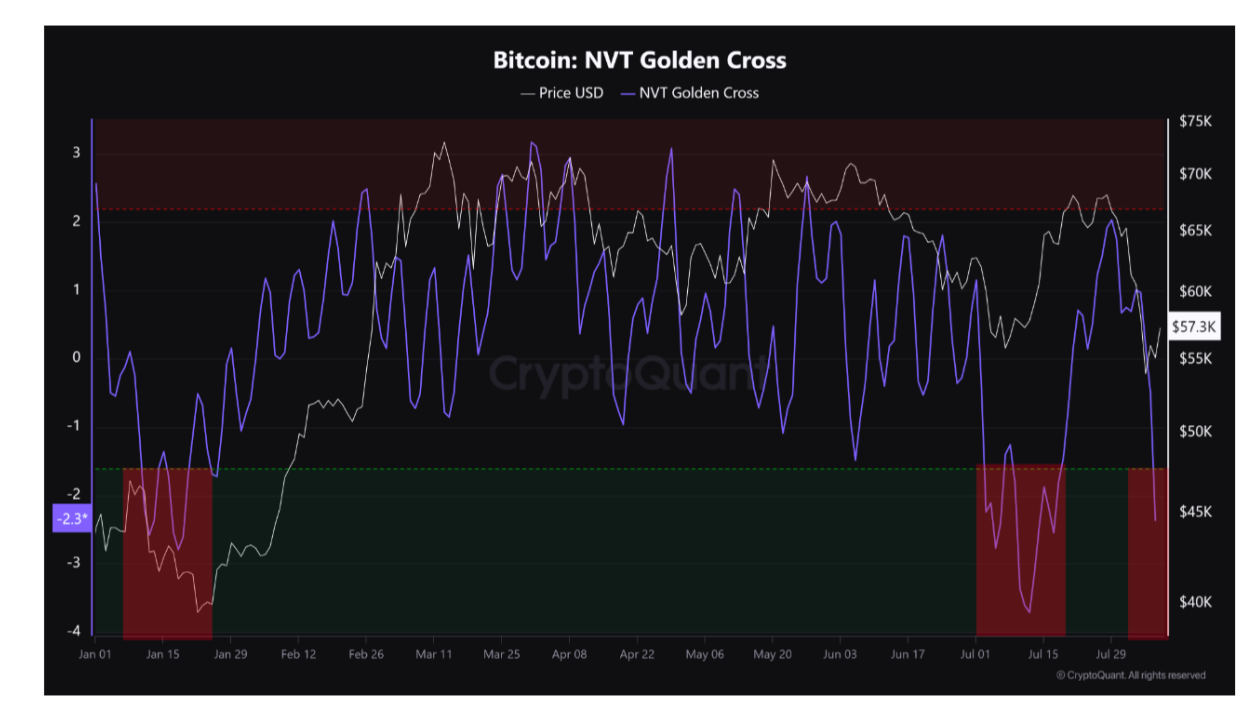
Burakkesmeci noted that the two previous bottom signals, which occurred on Jan. 18 and July 12, were followed by subsequent BTC price gains of 78% and 23%, respectively.
“Currently, we are in a local bottom area according to the NVT GC,” he concluded.
“Can the price go deeper? Yes, but we can expect the short-term trend to turn positive in this area.”
Bitcoin traders see $60K support failing
Bitcoin meanwhile traded around $60,000 through much of the weekend, data from Cointelegraph Markets Pro and TradingView confirms.
Related: 4 years in, MicroStrategy’s Bitcoin gamble beats Warren Buffett’s warning
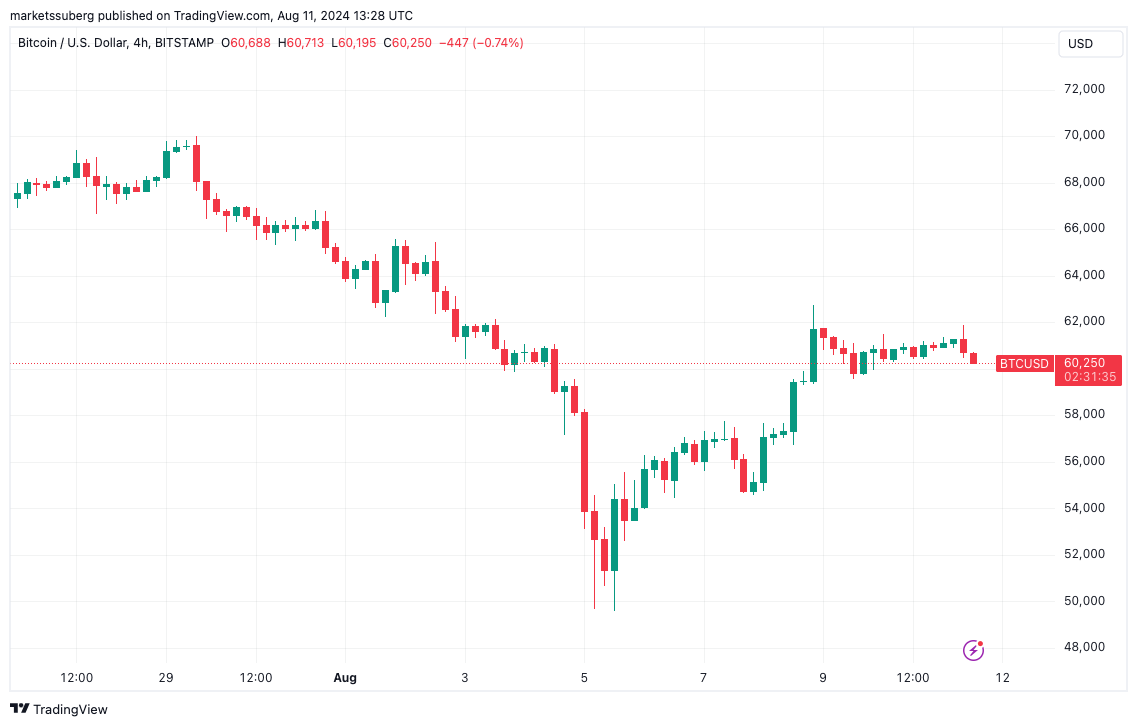
Despite holding support during “out of hours” trading, BTC/USD did not convince everyone, with some popular traders seeing the potential for a fresh dip.
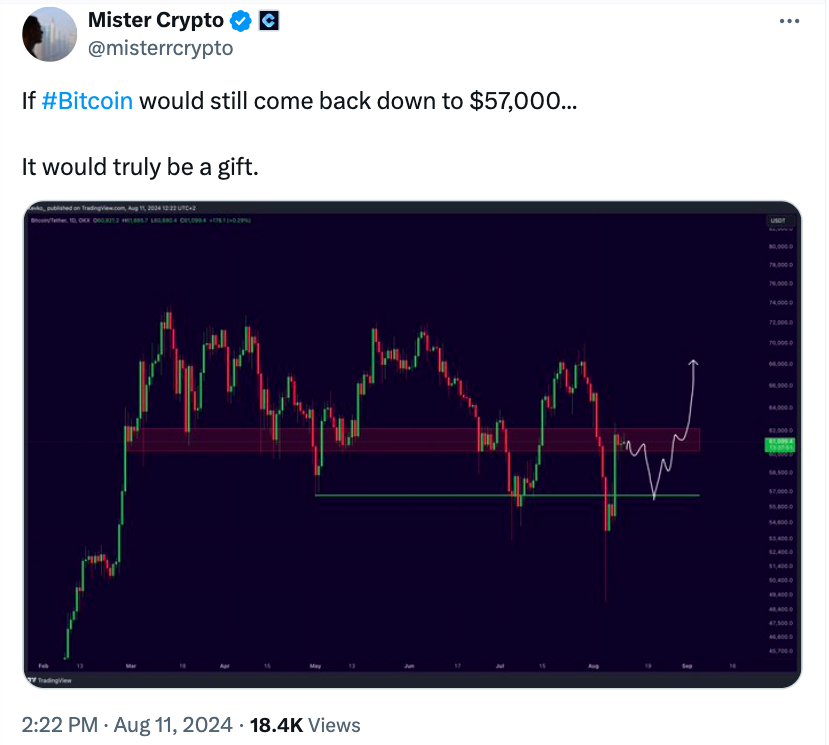
Uploading a chart showing key levels to X, Crypto Tony called for a return to $58,300 next.
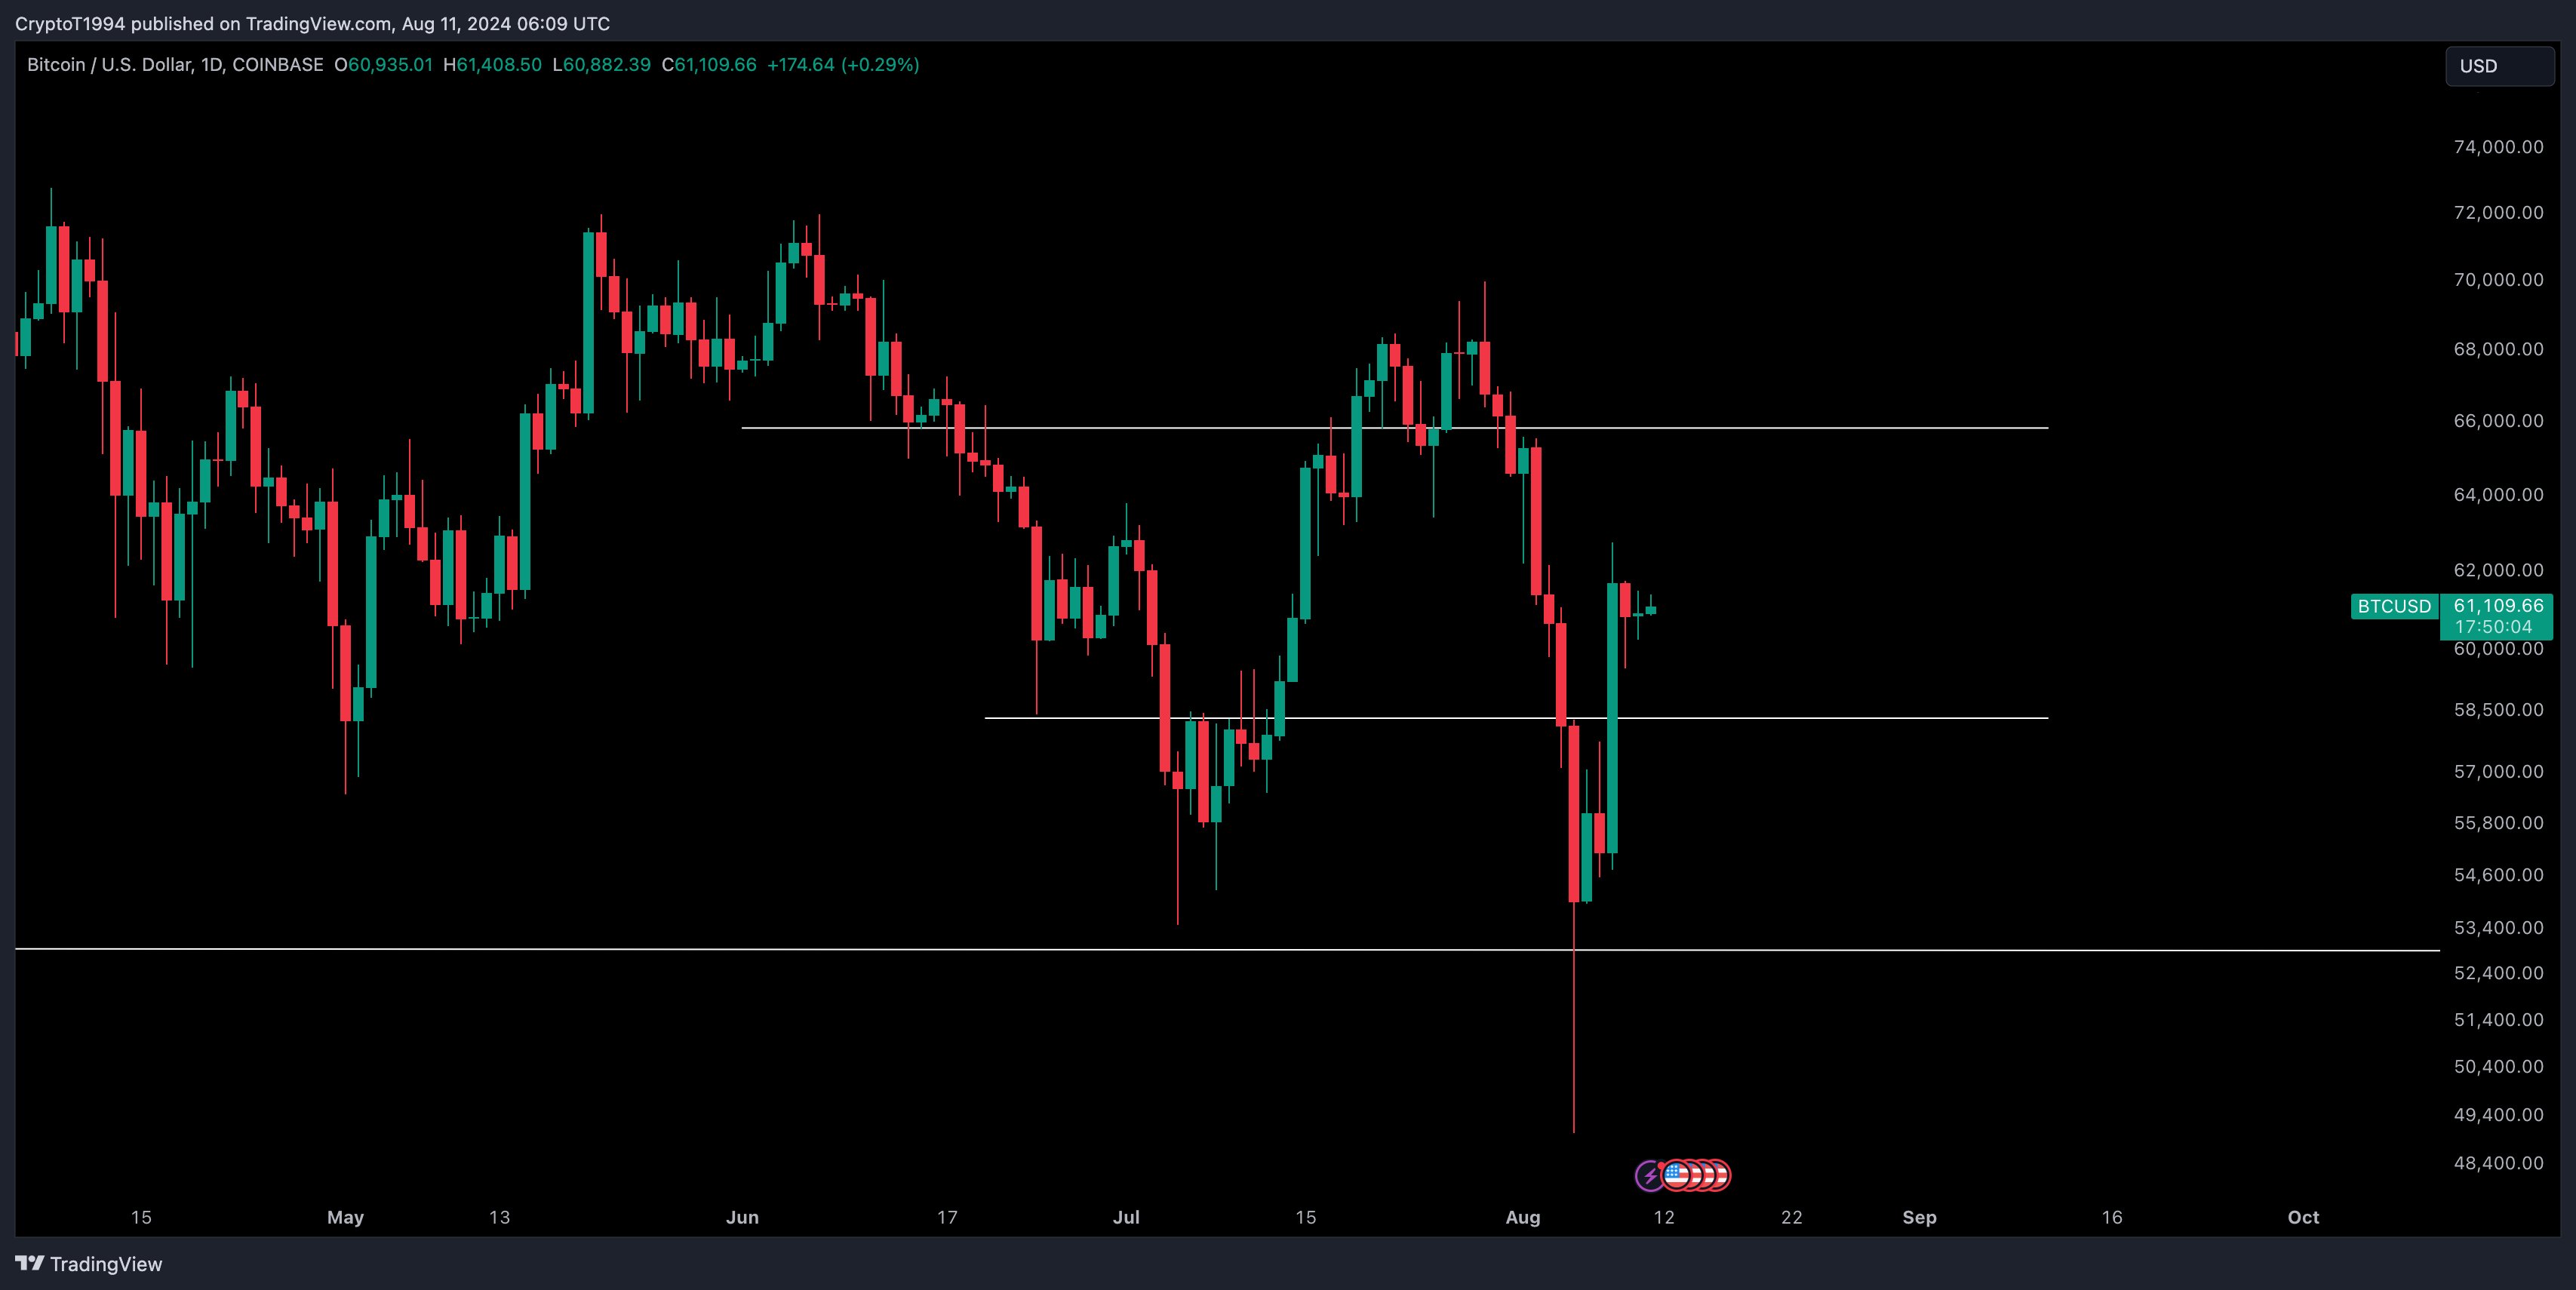
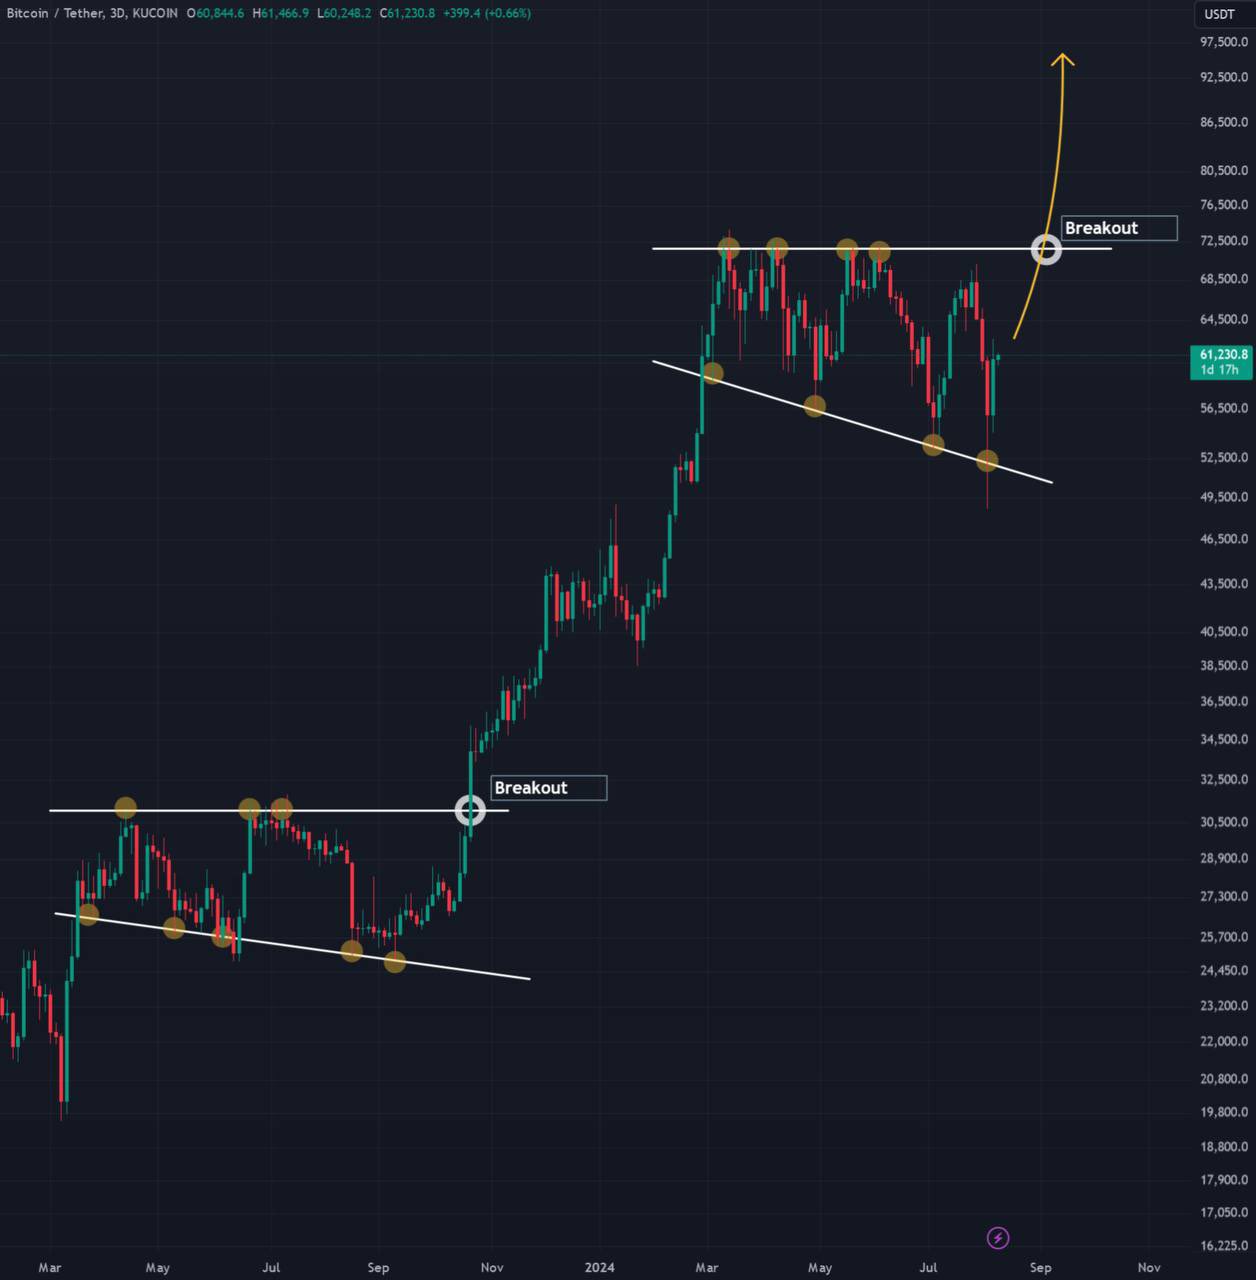
“Maybe one more retest of the lows before full reversal,” blockchain technology expert Elja Boom continued in part of his latest X commentary, which compared current price action to a year ago when BTC/USD briefly dipped to $25,000.
This article does not contain investment advice or recommendations. Every investment and trading move involves risk, and readers should conduct their own research when making a decision.





Responses