LEARN COPPOCK CURVE IN 3 MINUTES – BLOCKCHAIN 101
Content Summary
The Coppock Curve is a technical analysis indicator invented by economist Edwin Coppock in the 1960s, primarily used to identify long-term buying opportunities in the stock market and cryptocurrency markets. This educational article will take you in-depth on the calculation method, interpretation techniques, and practical application of the Coppock Curve. With detailed steps and real-case examples, we will reveal the power of this indicator, helping you better capture the long-term trends of the market and improve the success rate of investments.

What is the Coppock Curve Indicator?
The Coppock Curve is a long-term technical analysis indicator developed by economist Edwin Coppock in the 1960s, initially designed to help the United States Church Committee identify long-term buying opportunities in the stock market. This indicator is mainly used to identify long-term bottoms in the market, signaling the beginning of a bull market. It combines the rate of change in market prices (Rate of Change, RoC) and the weighted moving average (Weighted Moving Average, WMA) to provide a stable trend signal.
Components of the Indicator
Rate of Change, RoC: The rate of change measures the percentage change in price over a specific period. The Coppock Curve uses the rate of change over two periods: 14 months and 11 months. These periods are empirically chosen to capture medium to long-term market trend changes.
Weighted Moving Average, WMA: The weighted moving average averages data from different periods with certain weights to better reflect the trend of data changes. The Coppock Curve uses a 10-month weighted moving average to smooth the sum of the rate of change, reducing the impact of short-term fluctuations.
Calculation Steps
- Calculate the 14-month rate of change (ROC14).
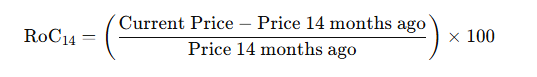
This formula represents the percentage change of the current price relative to the price 14 months ago.
- Calculate the 11-month rate of change (ROC11).
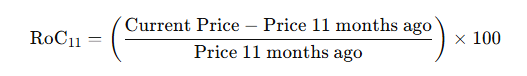
This formula represents the percentage change of the current price relative to the price 11 months ago.
- Calculate the sum of the rates of change:

Adding the 14-month and 11-month rates of change to obtain a comprehensive rate of change.
- Calculate the 10-month weighted moving average (WMA10) of the sum of the rates of change.

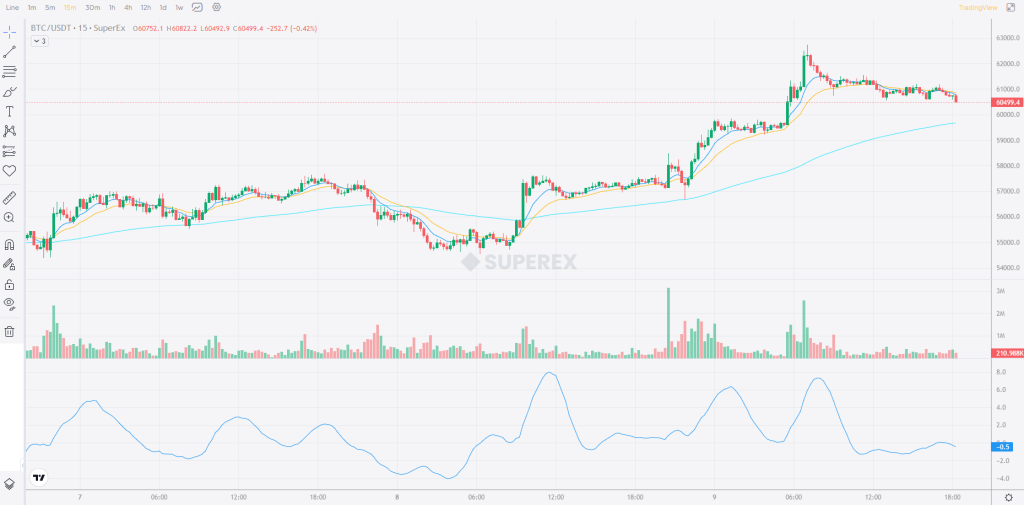
The final step is to calculate the 10-month weighted moving average of the sum of the rates of change. The purpose of this step is to smooth the data and reduce the impact of short-term fluctuations on the indicator. Of course, SuperEx also provides all users with a well-set Coppock Curve chart for analysis.
Interpretation of the Indicator
Buy Signal: When the Coppock Curve turns upward from below zero, it is a strong buy signal, indicating that the market may be about to enter a long-term uptrend. This turning point is generally considered the long-term bottom of the market.
Sell Signal: Although the Coppock Curve is not commonly used for sell signals, some traders will observe its turn downward at high levels as a potential exit point. This can help investors identify the long-term top of the market or adjust risk.
Application Scenarios
Stock Market: The Coppock Curve is often used for long-term trend analysis in the stock market, helping investors identify the beginning of a bull market.
Cryptocurrency Market: With the rise of the cryptocurrency market, the Coppock Curve has also been applied to analyze the long-term trends of crypto assets such as Bitcoin, helping investors find buying opportunities in market fluctuations.
By combining long-term rates of change and weighted moving averages, the Coppock Curve provides investors with a stable tool to identify long-term market trends, especially suitable for finding buying opportunities. Understanding and correctly applying this indicator can help investors make wiser decisions in the financial market.


IN-3-MINUTES@2x-1-1024x576.png)
-INDEX-IN-3-MINUTES@2x-1024x576-4.png)
Responses