LEARN TRIPLE EXPONENTIAL AVERAGE(TRIX) IN 3 MINUTES – BLOCKCHAIN 101

Introduction
In the cryptocurrency market, traders and investors often use various technical indicators to analyse market trends and predict price movements. Among them, the TRIX (Triple Exponential Average) indicator has become the tool of choice for many traders because of its unique characteristics and effectiveness.
The TRIX indicator is a momentum oscillator, and its core lies in its smoothing of price changes, which makes it more stable and sensitive to short-term market fluctuations.
In this article, we will take an in-depth look at the basic concepts of TRIX indicator, calculation methods, applications, and practical examples in the crypto market.

What is the TRIX indicator?
The TRIX indicator is a momentum oscillator originally proposed by Jack Hutson in the 1980s. It is based on the Triple Exponential Moving Average (TEMA) and is used to identify changes in trend and overbought or oversold conditions in the market. The core of TRIX lies in its smoothing of price changes, which makes it more stable and sensitive to short-term market fluctuations.
How to calculate the TRIX indicator
The steps to calculate the TRIX indicator are as follows:
- Calculate the Exponential Moving Average (EMA) of N days:
EMA1=EMA(price,N)
- Calculate the N-day EMA of EMA_1:
EMA2=EMA(EMA1,N)
- Calculate the N-day EMA of EMA_2:
EMA3=EMA(EMA2,N)
- Calculate the percentage change of EMA_3:
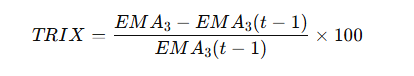
where N is the selected period length, usually 15.
How to apply the TRIX indicator?
Let’s use Bitcoin (BTC) as an example of how to apply the TRIX indicator in the cryptocurrency market.
Step 1: Calculate TRIX indicator
We assume 15 days as the period of TRIX, we first calculate the 15-day EMA of Bitcoin price, then calculate its second EMA and third EMA, and finally get the TRIX indicator.
Step 2: Analyse TRIX indicators
By analysing the TRIX indicator, we can observe the following phenomena:
Identify trend changes: When the TRIX indicator turns from negative to positive, it means that the trend has changed from downward to upward; conversely, when the TRIX indicator has turned from positive to negative, it means that the trend has changed from upward to downward.
Determine overbought and oversold conditions: When the TRIX indicator value is too high, the market may be overbought and prices may rebound; when the TRIX indicator value is too low, the market may be oversold and prices may rebound.
Used in conjunction with the signal line: A common practice is to use TRIX in conjunction with its signal line (that is, the moving average of TRIX). When TRIX breaks above the signal line, a buy or sell signal will be issued.
How to Interpret TRIX Curves
The TRIX curve is an important tool in technical analysis and can be directly called up in the SuperEx market indicator library. It helps user traders identify price trends, overbought and oversold conditions, and potential buy and sell signals. The following are detailed steps and methods for interpreting TRIX curves.
Identify trend changes
- Uptrend: When the TRIX main line turns from negative to positive, it indicates that the market may turn from a downward trend to an upward trend, which is a potential buying signal.
- Downtrend: When the TRIX main line turns from positive to negative, it indicates that the market may turn from an uptrend to a downtrend, which is a potential sell signal.
Confirm trading signal
- Buy signal: When the TRIX main line breaks through the signal line upward, it indicates that the market trend may be upward and it is suitable to buy.
- Sell signal: When the TRIX main line falls below the signal line, it indicates that the market trend may be downward and it is suitable to sell.
Overbought and oversold conditions
- Overbought state:When the TRIX main line continues to be at a high level and is far away from the signal line, the market may enter an overbought state and the price is at risk of a correction. It is suitable to consider selling or reducing positions.
- Oversold state: When the TRIX main line continues to be low and far away from the signal line, the market may enter an oversold state and the price may have a chance to rebound. Suitable for considering buying or increasing positions.
Summarise
The TRIX indicator is a powerful technical analysis tool that can help traders identify trend changes and overbought or oversold conditions in the market. By properly applying the TRIX indicator, combined with actual market data and trading strategies, investors can make more informed decisions in the cryptocurrency market. Of course, any technical indicator has its limitations. It is recommended that traders use a variety of indicators and methods to improve the success rate and stability of transactions.


Responses