LEARN PARABOLIC SAR (PSAR) IN 3 MINUTES – BLOCKCHAIN 101

INTRODUCTION
Many people mistakenly believe that financial trading and geometry belong to two completely different categories. However, geometry can also be used in technical indicators for technical analysis. It is Parabolic Sar, a technical indicator based on geometry, which many traders like to use in their trading.
Today we will talk about the Parabolic SAR indicator, how it works and how to use it in trading.

What is the PSAR indicator?
The Parabolic SAR indicator, or PSAR for short, was invented by J. Welles Wilder in the late 1970s. It is a leading technical indicator that shows the trend of price changes in the market and signals when the price direction is determined as well as when the price direction changes. It is described in Wilder’s book, New Concepts in Technical Trading Systems, as well as in other commonly used indicators, such as the Relative Strength Index (RSI).
In fact, Wilder refers to this method as a parabolic time/price system, and the concept of SAR is as follows:
SAR indicates a stop and reversal. This is the point at which one exits a long trade and enters a short trade and vice versa.
– Wilder, JW, Jr. (1978). New Concepts in Technical Trading Systems (p. 8)
Today, the PSAR indicator is used as a tool to identify market trends and potential reversal points. It shows the trend of price changes in the market and signals when a price direction is identified as well as when a change in price direction occurs. With this feature and predictive accuracy, the PSAR indicator has gained popularity in the crypto trading market.
Wilder wanted to find a system that would maximize profits from trend movements. He eventually created the PSAR indicator, which allows you to calculate the start and end points of new trends.
At the same time, PSAR does not try to guess the peaks of the movement. It tracks the trend movement and allows you to maximize your profits by gradually adjusting your Take Profit levels.
It is possible to use this indicator for any trading instrument during a trend movement. However, the developers do not recommend using the indicator in time frames of less than one hour. It is also not recommended to use the indicator during sideways periods. During sideways consolidation, the PSAR indicator sends a lot of false signals.
How to Calculate Parabolic Turn Indicator
An algorithm using two parabolic turn indicator formulas is used to calculate the parabolic turn indicator.
The first formula is used for long positions (uptrend):
PSAR(i) = (HIGH(i-1) – PSAR(i-1)) * AF+PSAR(i-1)
The second formula is used for short positions (downtrend):
PSAR(i) = (LOW(i-1) – PSAR(i-1)) * AF+PSAR(i-1)
Notes:
- PSAR is the parabolic steering indicator value. Indicator symbol (i) indicates the current value, (i – 1) indicates the value of the previous cycle.
- HIGH is the highest price.
- LOW is the lowest price.
- AF is the acceleration factor. When a new price extreme is reached, the indicator value increases in steps set for each cycle, Wilder recommends 0.02 as an initial factor, and for each new candlestick, the AF value increases by 0.02 until it reaches a maximum value of 0.2.
AF formula: АF = 0,02 + ix*K
Remarks:
- ix is the number of accumulated periods since the beginning of counting;
- K is the step size of price change, the default value is 0.02.
How to use the PSAR indicator for effective trading
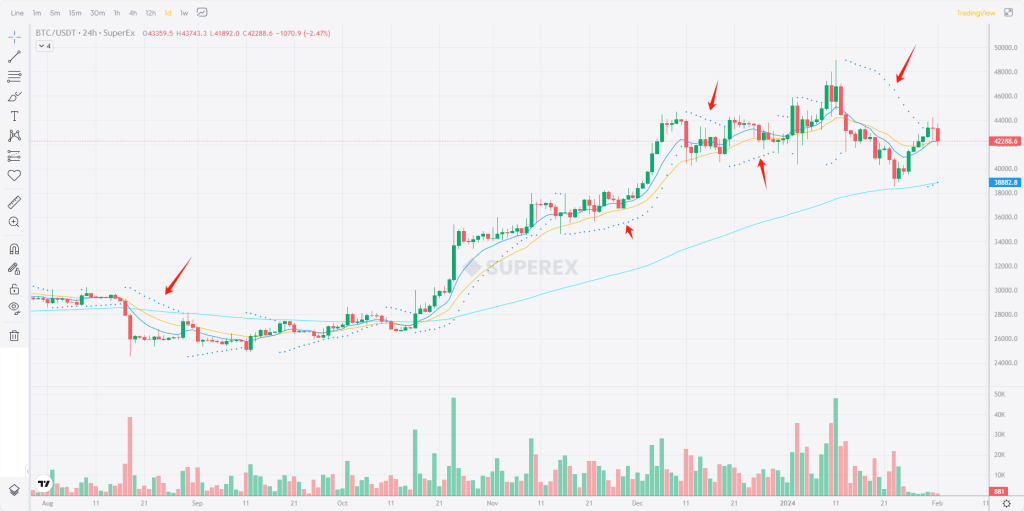
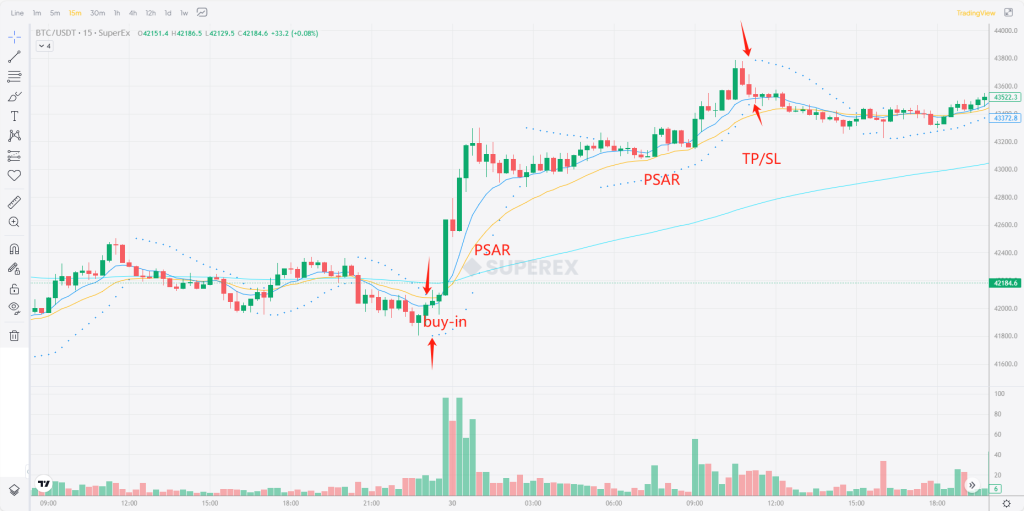
Let’s learn the logic of the PSAR indicator in one sentence: in an uptrend, the parabolic stop is located below the price, while in a downtrend it is located above the price. When the price crosses the parabolic stop, this may indicate a trend reversal.
Simple to understand:
When price action is in an uptrend, the PSAR indicator is located below the price, and the intersection of the PSAR and the price is the trend reversal point, which is also our entry point and stop loss and take profit point.
When the price trend is in a downtrend, the PSAR indicator is located above the price, this time the intersection of PSAR and price is the trend reversal point, but also our take profit and stop loss points and entry points.
This is an alternating cycle of the process, observe the PSAR and the intersection of price, you can effectively carry out trend judgment, as shown below:
Summarize
No market analysis tool can guarantee 100% accuracy. Therefore, before using PSAR or any other strategy, investors should ensure that they have a good understanding of financial markets and technical analysis. They should also have proper trading and risk management strategies to avoid the inevitable risks.
Finally, because the PSAR indicator doesn’t take trading volume into account, it doesn’t provide much information about the strength of the trend.


Responses