LEARN EASE OF MOVEMENT IN 3 MINUTES – BLOCKCHAIN 101

Introduction
The Ease of Movement (EMV) indicator is not just a cold data of price and trading volume, but also a vivid reflection of market fund flow. In the previous courses, we discussed various courses that reflect the relationship between quantity and price, such as MFI indicators, CMF indicators, etc. However, investment is always a risky activity, and relying too much on any single indicator can lead to misjudgment. Therefore, this article will explore the mysteries of EMV and provide investors with more choices when making decisions!
Please keep it in your mind that the more indicators support your accuracy in market judgment, the higher the accuracy of your judgment!
The Ease of Movement (EMV) indicator is a technical analysis tool proposed by Richard W. Arms Jr. in the 1960s, aimed at helping investors assess the flow of funds in the market. The design philosophy of EMV mainly focuses on the relationship between price fluctuations and trading volume, aiming to provide more comprehensive market insights.

History background
The proposal of EMV is to address the shortcomings of traditional price and volume analysis. During that period, investors mainly relied on price trends and trading volume to make decisions, but the relationship between these two was not fully explored. Richard W. Arms Jr. attempted to gain a deeper understanding of the activities of funds in the market by introducing EMV, in order to better guide investment decisions.
Principles of Calculation
The calculation of EMV involves two main concepts: Typical Price and Box Ratio. Typical Price is determined by the average of the highest, lowest, and closing prices, which helps to reflect the market’s equilibrium state. The Box Ratio, on the other hand, is a ratio that balances trading volume and price fluctuations, and its introduction enables the formation of EMVs.
EVM formula
EMV={(H+L)/2-(Hprev+Lprev)/2}/(H-L)/V
Among them, H is the highest price of the current cycle, L is the lowest price of the current cycle, Hprev and Lprev are the highest and lowest prices of the previous cycle, and V is the trading volume of the current cycle.
Application methods
EMV is mainly used to measure the activity and flow direction of funds. Investors can pay attention to the trend lines and intersections of EMV to determine the trend of capital inflows or outflows. The upward trend of EMV may indicate a large influx of funds into the market, which may be a buying signal; The downward trend of EMV may indicate that funds are flowing out and may be a potential selling signal.
Practical operation
In practical operation, investors can obtain the EMV chart of a certain currency through SuperEx and analyze it in combination with trend lines, intersections, and other forms.
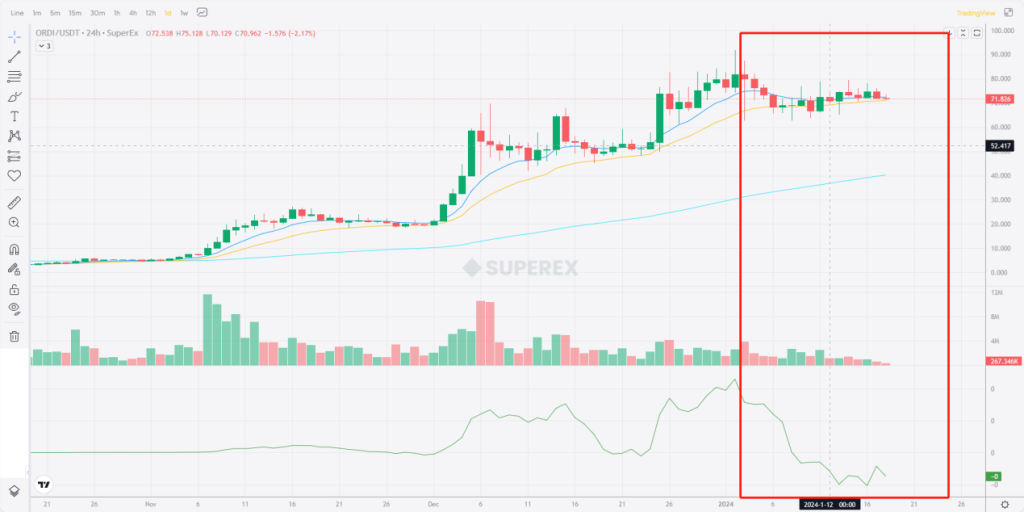
Taking Ordi as an example, we can see the flow of funds behind each rise and fall by calling up the EMV indicators in the SuperEx indicator database. Taking the latest price as an example, although Ordi prices experienced a small shock, the EMV line is going down precipitously, indicating that the shock was caused by the flow-out of funds from the market. At the same time, the bottom of the line began to smooth , indicating that the probability of flow-out funds leave the market ended, and the market was in a state of shrinking.
Shrinking sideways is a very rare opportunity to enter the market, although there is still a possibility of a slight fall, the overall upward trend has not changed, only waiting for new flow fund to enter.
Of course, this is only a rough judgment based on the EMV indicator, and the specific trend and entry timing still need to be supported by more indicator analysis.
The introduction of EMV enriches investors’ market analysis toolbox and provides them with a more comprehensive market perspective. However, investment decisions still require multi factor analysis and should not overly rely on any single indicator. As part of technical analysis, EMV provides investors with more accurate market signals, but in practical application, caution should be exercised.



Responses